IOX: Ability to visualize multiple fields & field names reflected in axis drop down selection
- Dominant language
- TypeScript
- Stars
- 117
- Forks
- 51
- Avg merge
- 2d 15h
- Merged PRs (30d)
- 4
Description
**Proposal:**
Add the ability to visualize multiple fields simultaneously.
**Current behavior:**
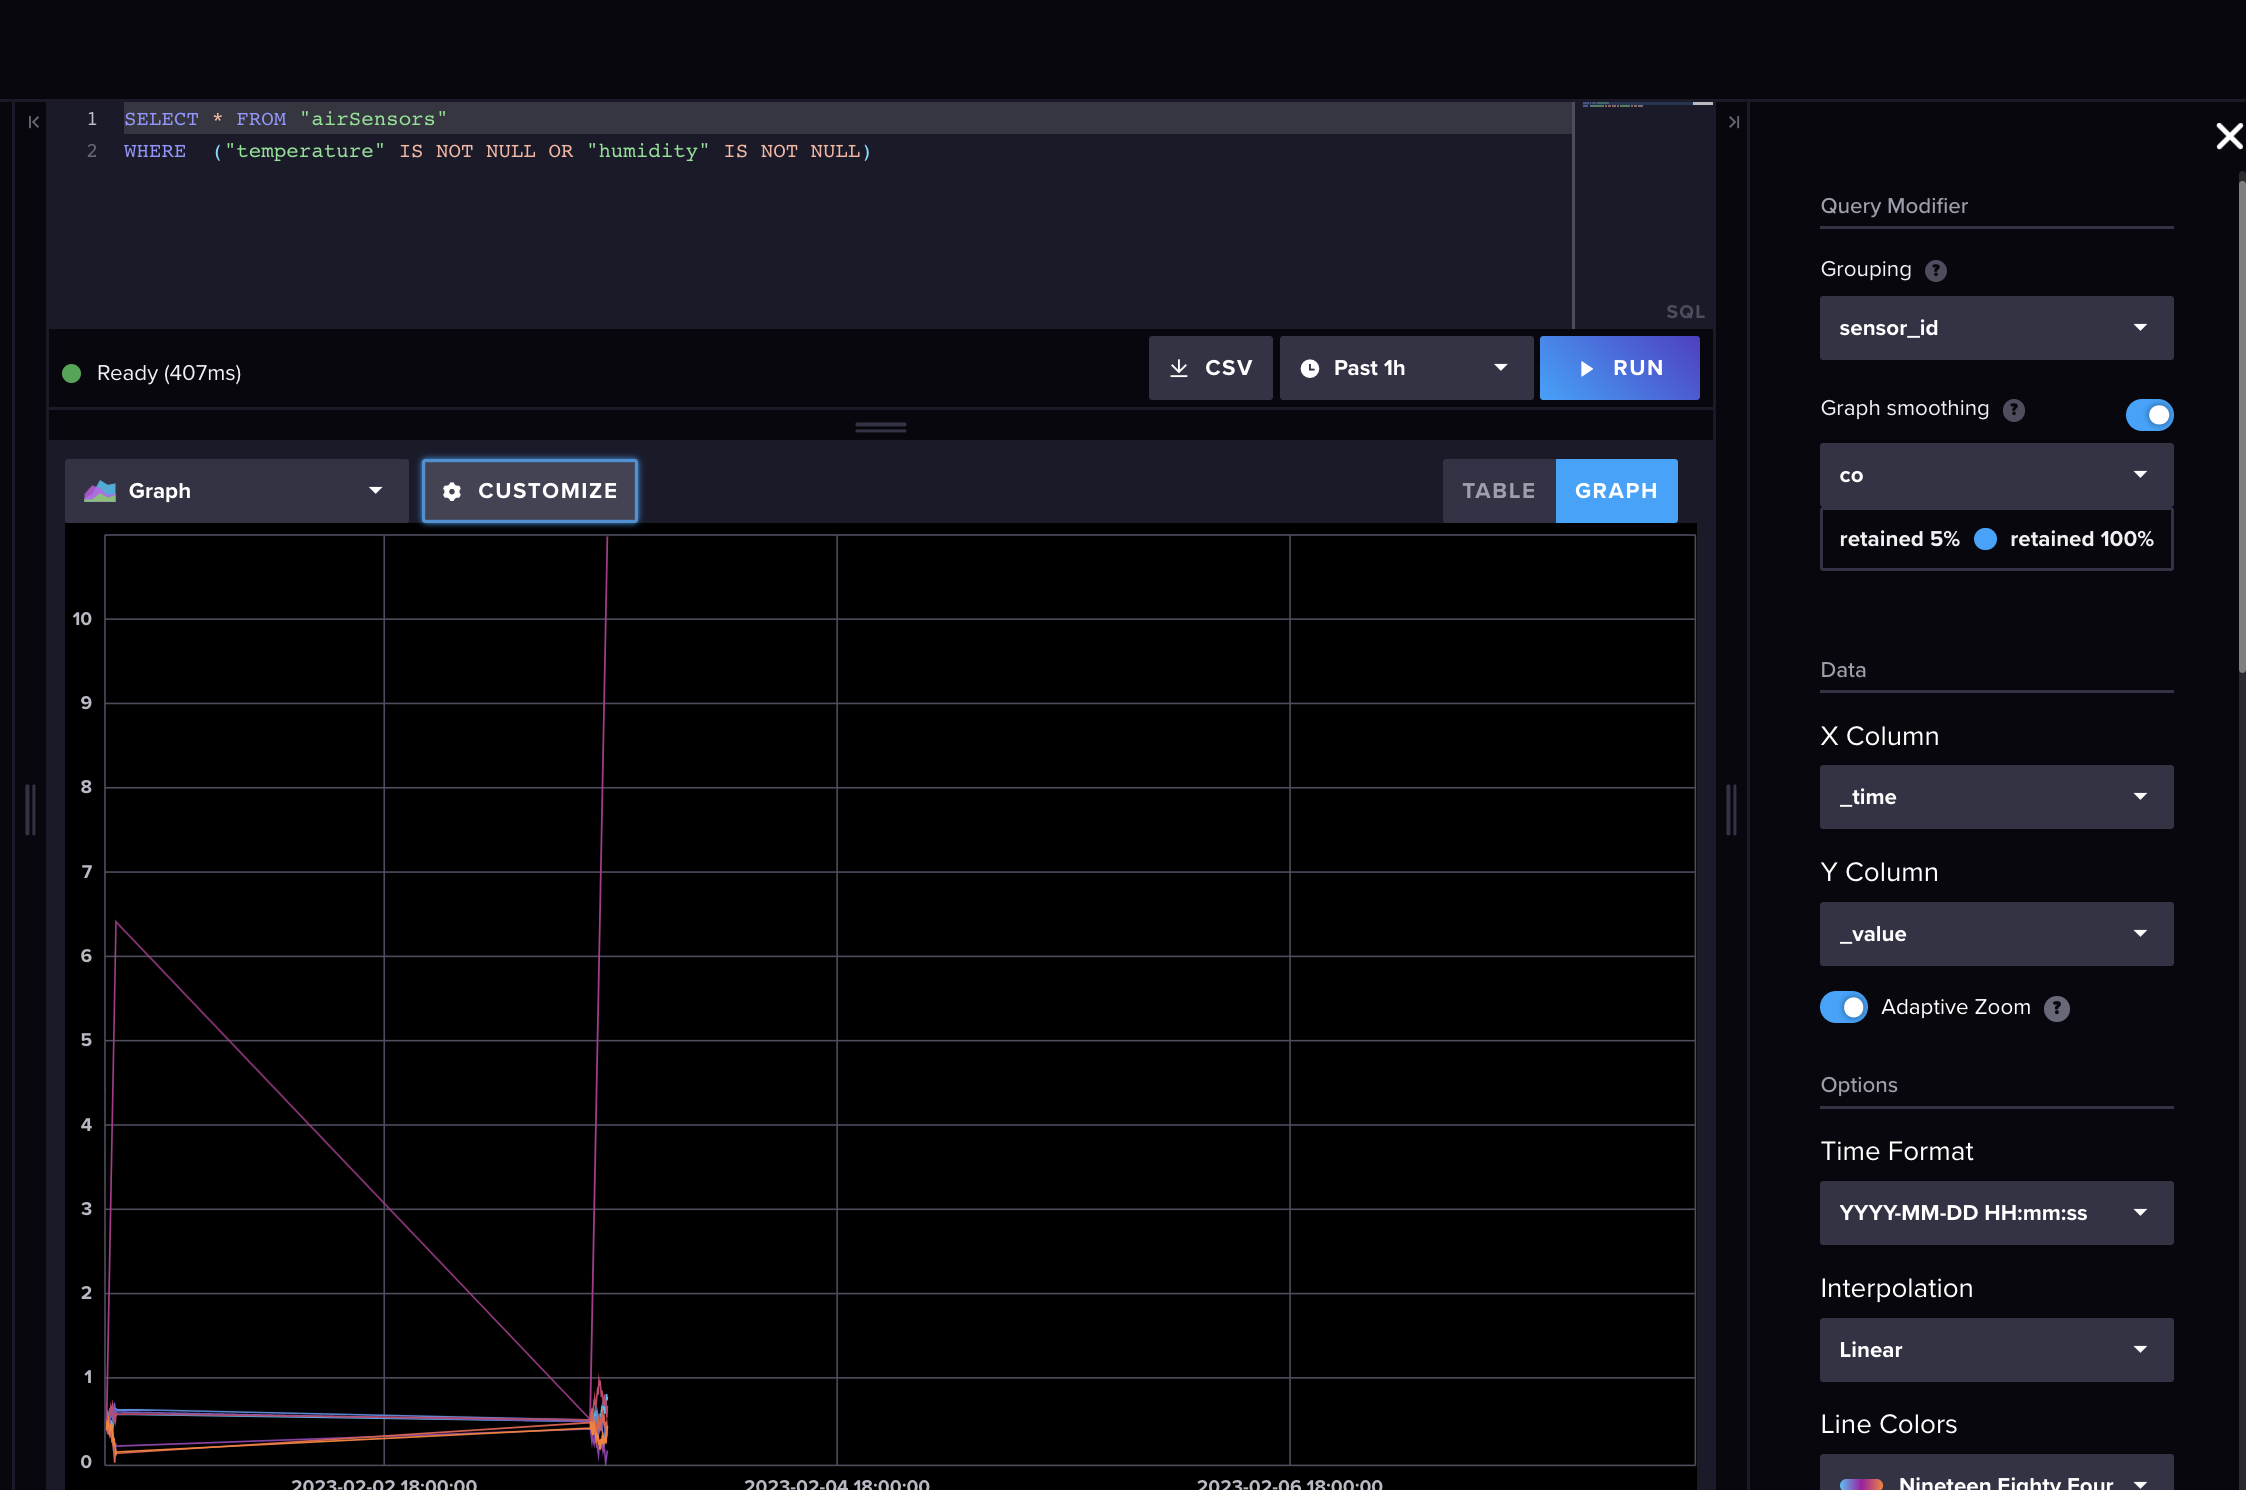
You can only visualize one "_value". It's unclear which value is being visualized.
**Desired behavior:**
It would be great if you could select multiple fields for the y-axis drop down.
It would also be useful if instead of "_value" the dropdown included the columns that you wanted to visualize. I don't know if it's intuitive that "co" is being visualized here.
**Use case:**
I believe the ability to graph multiple fields was available with 1.x and influxql. The requirement of using multiple yields was a big hurdle for Flux users who were accustomed to being able to visualize multiple fields with InfluxQL. I believe SQL users expect to be able to visualize multiple fields simultaneously as well.
Thank you!
Contributor guide
No contributing guide indexed for this repository
Assessment
This issue has not been assessed yet.