new data explorer charts not updating x axis when time range changes
- Dominant language
- TypeScript
- Stars
- 117
- Forks
- 51
- Avg merge
- 2d 15h
- Merged PRs (30d)
- 4
Description
## About the bug
**Steps to reproduce:**
List the minimal actions needed to reproduce the behavior.
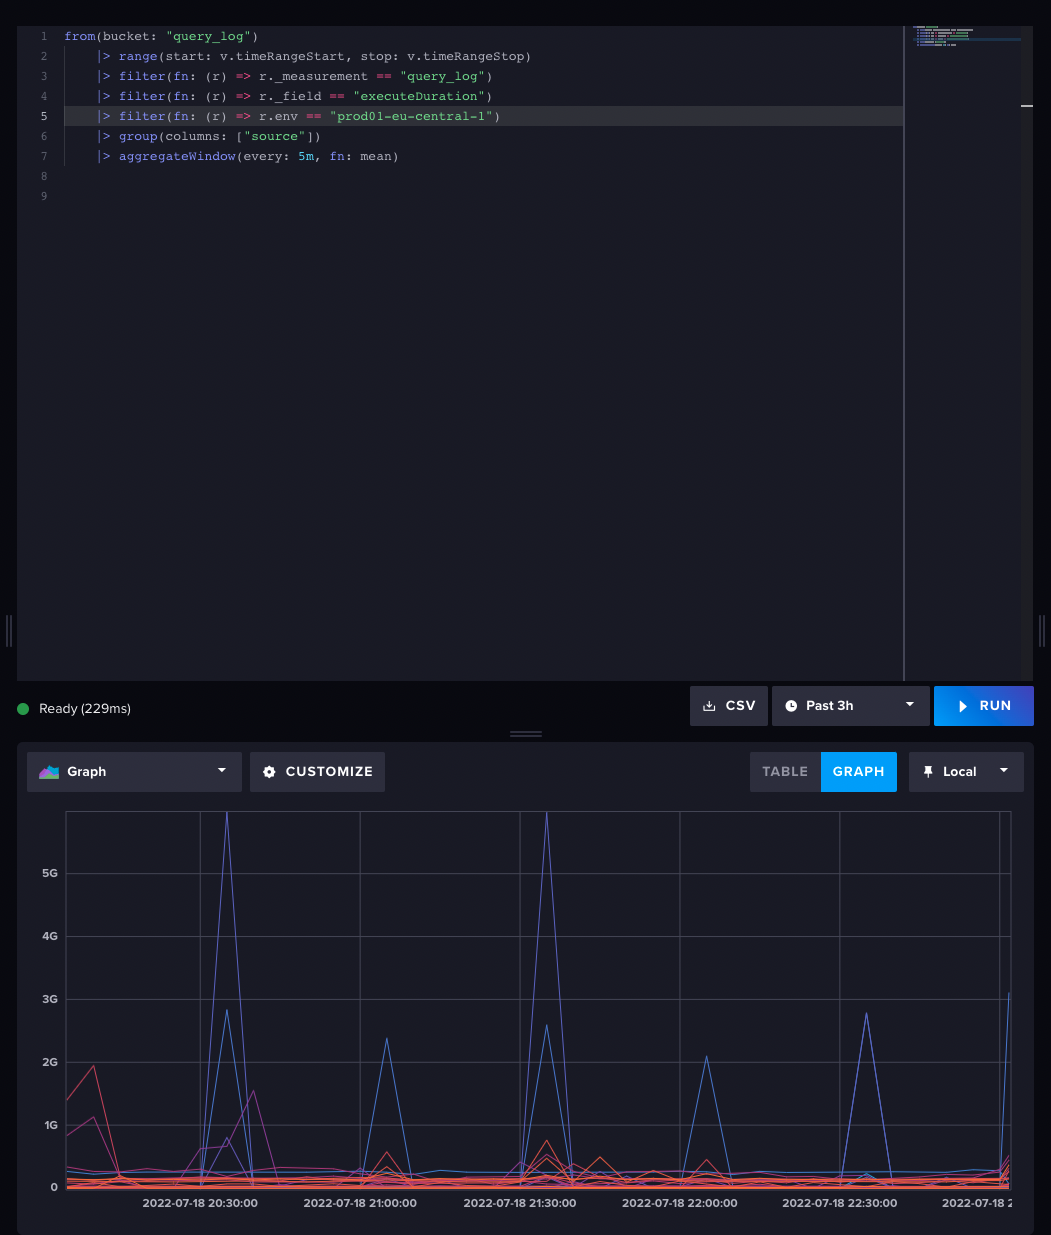
1. Set a time range in the dropdown to 3h using v.timeRangeStart and v.timeRangeStop
2. run the query
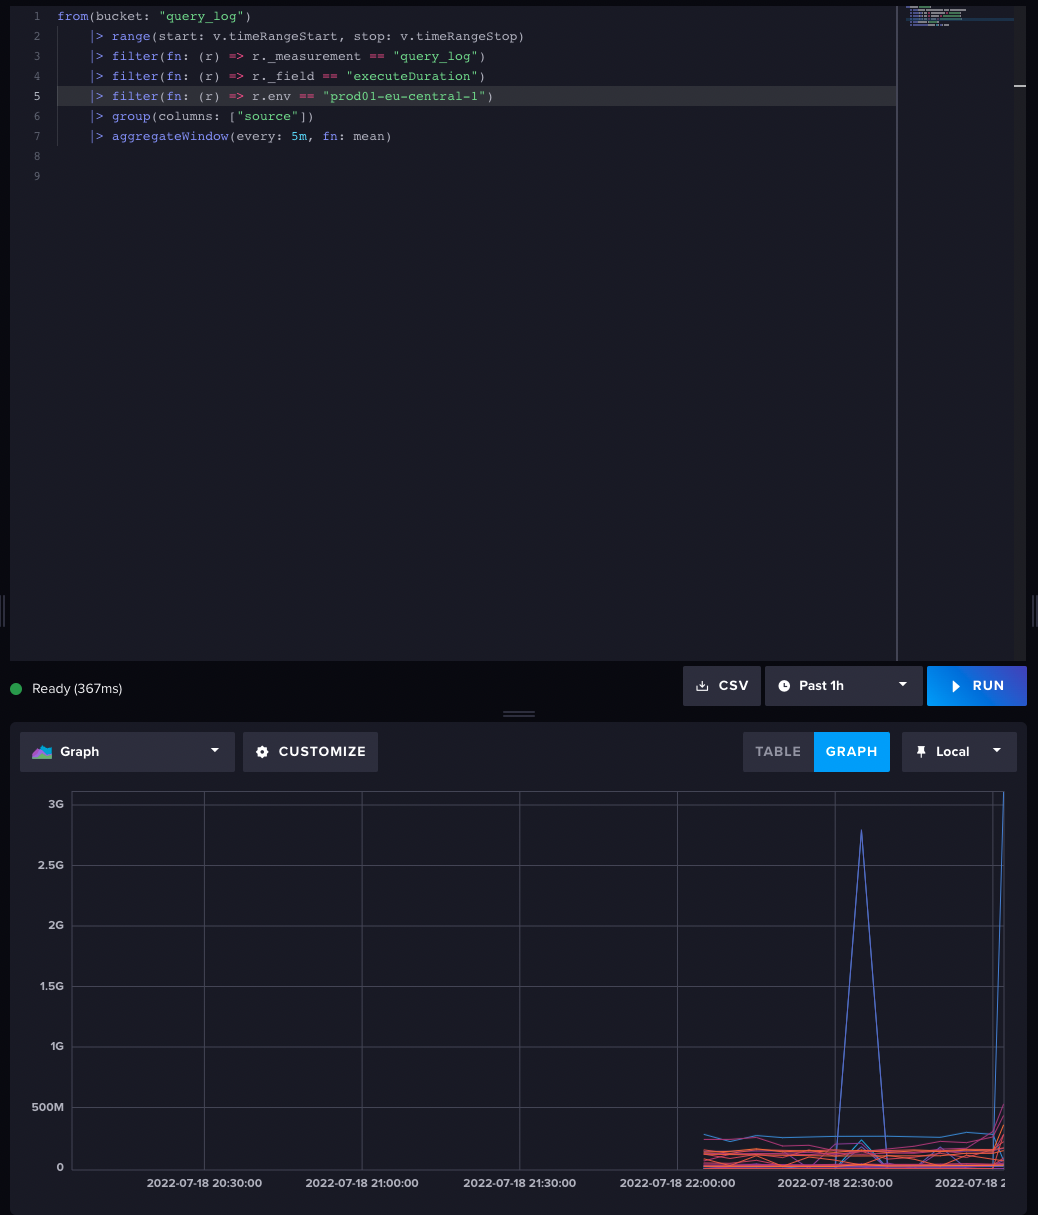
3. Change the time range using the UI dropdown to 1h
**Expected behavior:**
the graph refreshes with the x axis focused on the chosen time range
**Actual behavior:**
the data refreshes but the axis does not change. The steps above make the bug obvious, but the same error occurs going from a smaller time range to a larger one, but in this case the whole range of the graph is filled and user may not notice the error unless they read the axis labels.
Further, it appears that when the time range shifts based on "last 5m" that the chart similarly does not update.
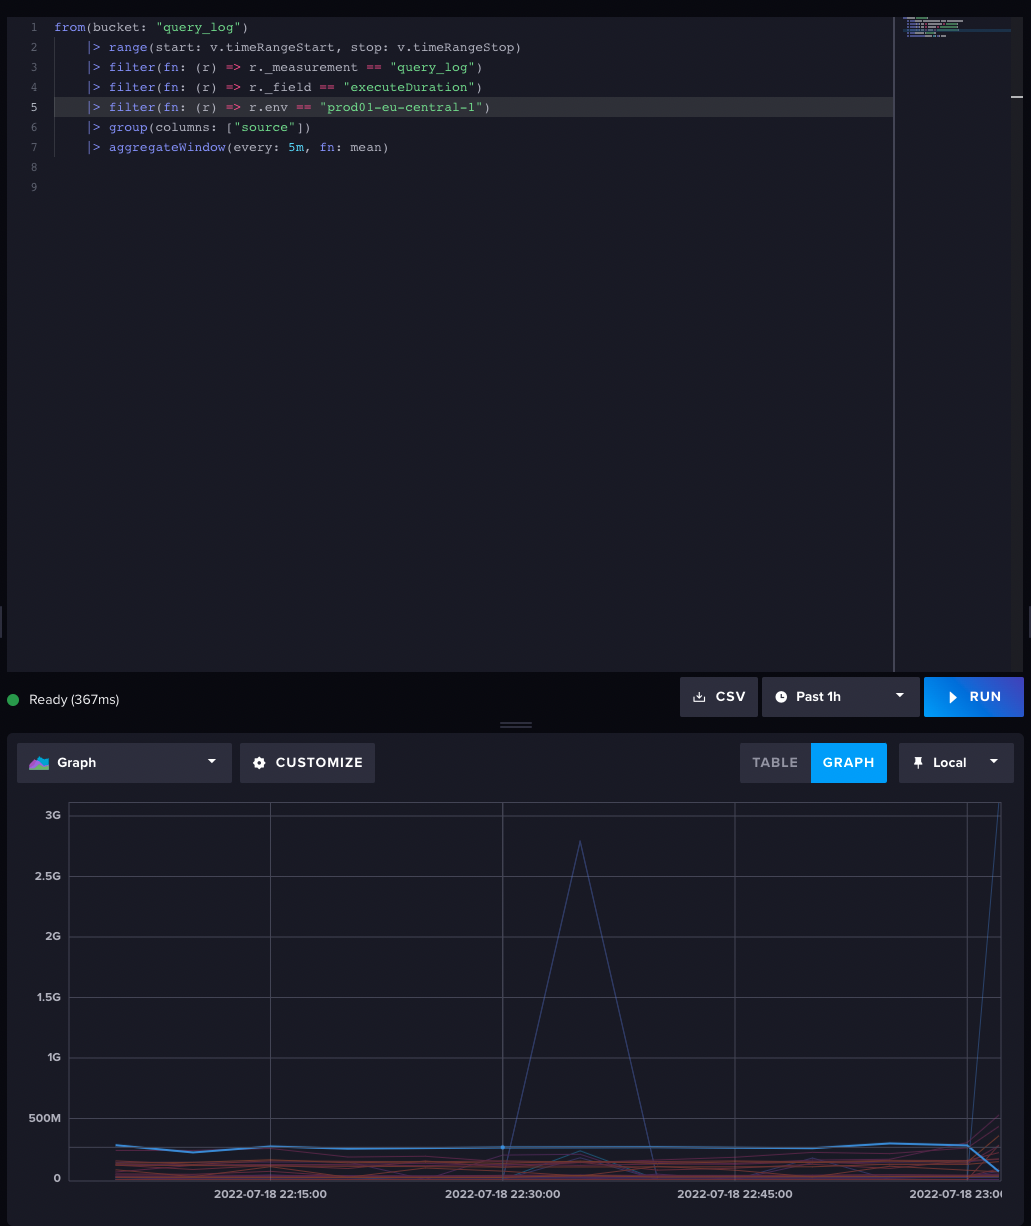
NOTE: double clicking the chart updates the axes.
**Visual Proof:**
3 hour:
1 hour:
after double click:
## About your environment
**Environment info:**
cloud2 UI
Contributor guide
No contributing guide indexed for this repository
Assessment
This issue has not been assessed yet.