Data Explorer doesn't show measurements and fields of data written via Influx Task
- Dominant language
- TypeScript
- Stars
- 117
- Forks
- 51
- Avg merge
- 2d 15h
- Merged PRs (30d)
- 4
Description
When writing data to InfluxDB Cloud via a client (e.g. Java), I can see my measurements and fields written in data explorer. There is a filter for _measurement and for _field available listing all measurements and fields in the bucket, making it easy to narrow down data for visualization in UI. In this example: machinedata.
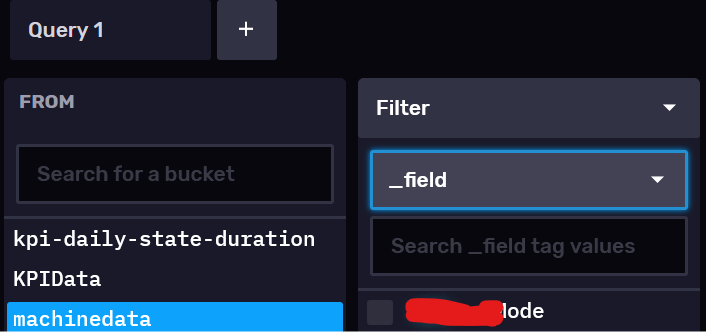
However, when writing data via a flux task, there is nothing shown in data explorer as filter, so I can't use the visual query builder but must write my flux script myself.
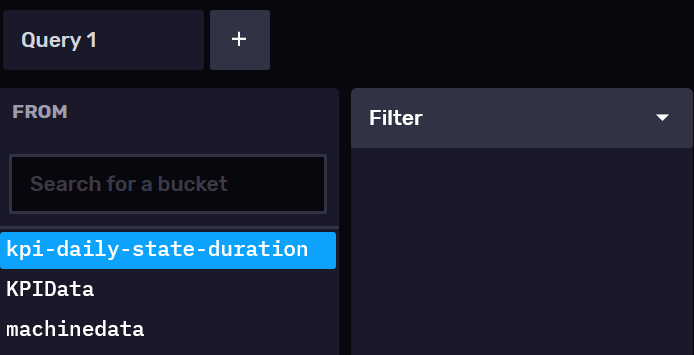
In Slack, it was noted that a browser refresh might help, but that doesn't solve the issue for me. I tried reloading, reloading with CTRL+F5, restarting browser or using another browser I never opened influx ui with (So I tried Firefox and Chrome). I also waited several days to see if the issue disappears, but it remains. I am sure though that the data exists:
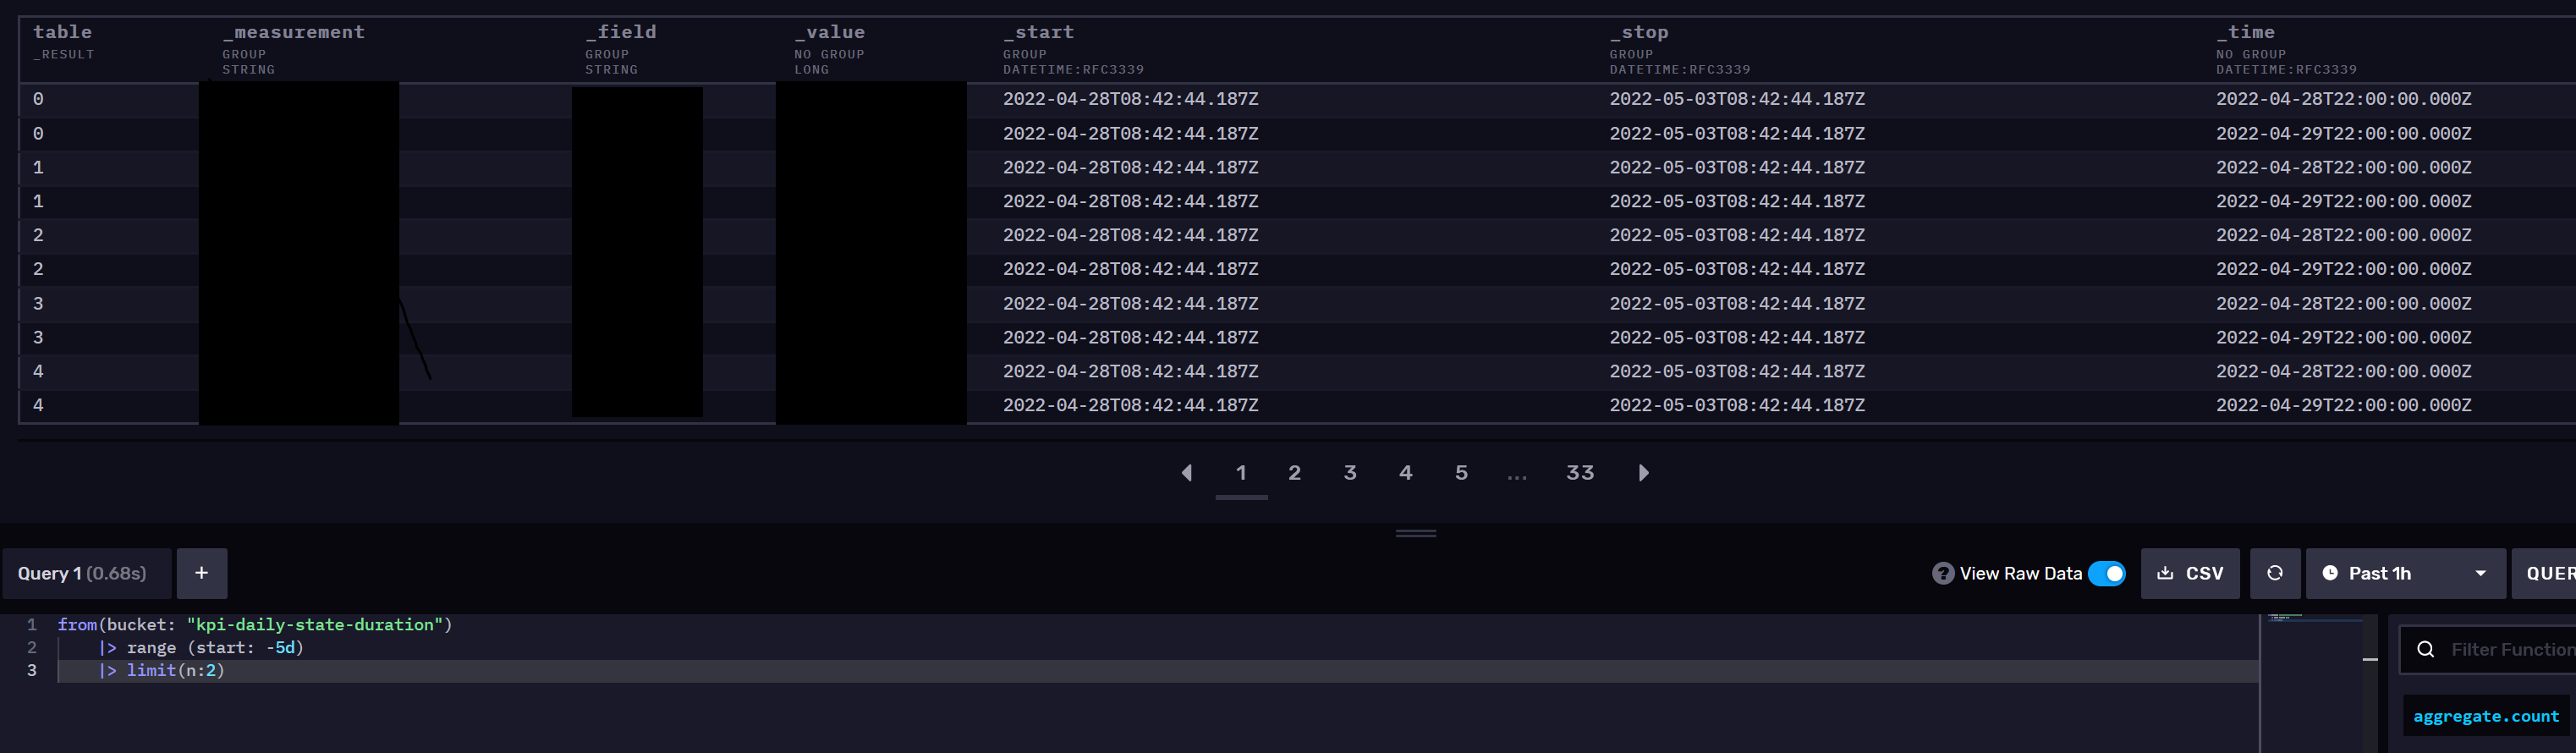
The bucket at hand has schema type "implicit", data was never written via a client, only via flux task. I actually tried out two flux tasks, one with writing via `to` and one with pivoting and then writing via `experimental.to`, both lead to the same result. I can query the data from flux a fluxscript just nice, I can write flux script like `schema.measurements(bucket: "kpi-daily-state-duration")` properly listing all measurements, but I don't see anything in the UI.
Contributor guide
No contributing guide indexed for this repository
Assessment
This issue has not been assessed yet.