Annotations disappear if range doesn't fully encompass existing data or straddles a date change
- Dominant language
- TypeScript
- Stars
- 117
- Forks
- 51
- Avg merge
- 2d 15h
- Merged PRs (30d)
- 4
Description
__Steps to reproduce:__
Use pivot() and fill()
This may or may not be be relevant (i.e. there are no columns called _value)
Create an annotation of a period that crosses a date boundary.
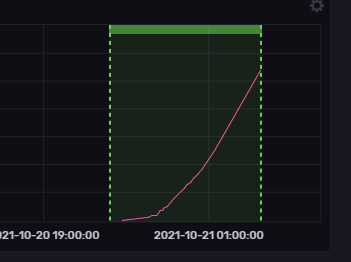
Set the Stop Time of the annotation to be **smaller than the last timestamp in the data being displayed*
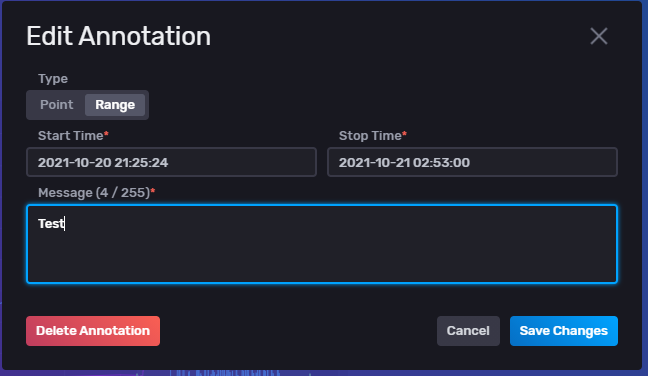
RESULT: The Annotation appears fine...
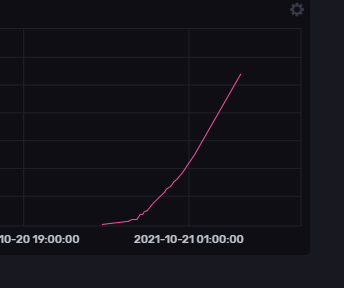
Set the Stop Time of the annotation to be **GREATER than the last timestamp in the data being displayed*
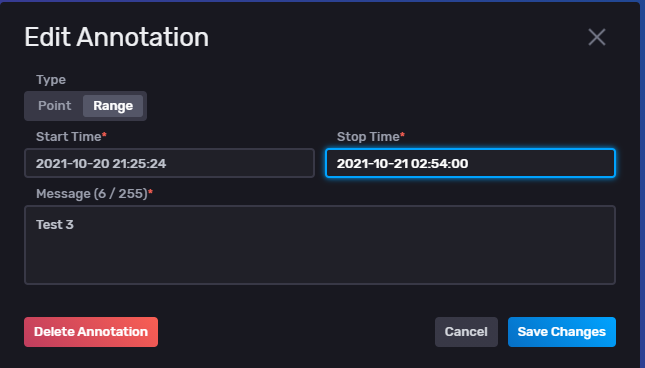
RESULT: The Annotation disappears.
There are multiple other weird effects of annotations:
- Annotations don't get loaded with the timestamp of the point clicked to create the Annotation.
- Annotations that cross date boundaries don't appear properly even if the data does go beyond the time set
- Annotations don't contain dates if you have not selected to display dates on the X-axis (therefore it sometimes complains of dates in the past when they are not in the past they just don't have dates in the timestamps)
- Annotations that are off the page when zooming occurs are placed on the wrong point of the x axis.
- Annotations can't be used sensibly when x axis is not _time (even though these might be desired)
- Annotations aren't available for scatter plots even though this might be desired
- Annotations are not available in Books for regular charts.
__Expected behavior:__
Clearly Annotations should land where you put them and stay there EVEN in the case where the annotation is past the last data point that can be displayed. OR in the case where the Annotation straddles a date change
__Actual behavior:__
Annotations disappear and or fail to appear without any explanation
__Environment info:__
* System info: InfluxDB cloud UI
Contributor guide
No contributing guide indexed for this repository
Assessment
This issue has not been assessed yet.