WebUI no accessible through nginx
- Dominant language
- TypeScript
- Stars
- 117
- Forks
- 51
- Avg merge
- 2d 15h
- Merged PRs (30d)
- 4
Description
Hi all.
When i install Grafana + InfluxDB2 via docker all works fine, but if trying access to InfluxDB2 UI through nginx i see blank page.
**Steps to reproduce:**
docker-compose file:
```
services:
influxdb:
image: influxdb:latest
container_name: influxdb
hostname: influxdb
restart: always
ports:
- '8086:8086'
volumes:
- influxdb-storage:/var/lib/influxdb2
environment:
TZ: Europe/Moscow
DOCKER_INFLUXDB_INIT_MODE: setup
DOCKER_INFLUXDB_INIT_USERNAME: ${INFLUXDB_ADMIN_USERNAME}
DOCKER_INFLUXDB_INIT_PASSWORD: ${INFLUXDB_ADMIN_PASSWORD}
DOCKER_INFLUXDB_INIT_ORG: myorg
DOCKER_INFLUXDB_INIT_BUCKET: telegraf
DOCKER_INFLUXDB_INIT_ADMIN_TOKEN: 'my_token'
INFLUXD_REPORTING_DISABLED: "true"
INFLUXDB_DB: grafana
INFLUXDB_HTTP_AUTH_ENABLED: 'true'
INFLUXDB_REPORTING_DISABLED: 'true'
networks:
- local-network
telegraf:
image: telegraf:latest
container_name: telegraf
hostname: telegraf
restart: always
ports:
- '8125:8125/udp'
volumes:
- telegraf-storage:/var/lib/telegraf
- /var/run/docker.sock:/var/run/docker.sock
- ./etc/telegraf/telegraf.conf:/etc/telegraf/telegraf.conf
environment:
INFLUXDB_URL: http://influxdb:8086
INFLUX_TOKEN: 'my_token'
depends_on:
- influxdb
links:
- influxdb
networks:
- local-network
chronograf:
image: chronograf:latest
container_name: chronograf
hostname: chronograf
restart: always
ports:
- '127.0.0.1:8888:8888'
volumes:
- chronograf-storage:/var/lib/chronograf
depends_on:
- influxdb
environment: #sourced from .env
INFLUXDB_URL: http://influxdb:8086 #host same as container name
INFLUXDB_USERNAME: ${INFLUXDB_ADMIN_USERNAME}
INFLUXDB_PASSWORD: ${INFLUXDB_ADMIN_PASSWORD}
REPORTING_DISABLED: "true"
networks:
- local-network
grafana:
image: grafana/grafana:latest
container_name: grafana
hostname: grafana
restart: always
ports:
- '3000:3000'
volumes:
- grafana-storage:/var/lib/grafana
- ./etc/grafana:/etc/grafana
depends_on:
- influxdb
environment:
TZ: Europe/Moscow
GF_SECURITY_ADMIN_USER: ${GRAFANA_USERNAME}
GF_SECURITY_ADMIN_PASSWORD: ${GRAFANA_PASSWORD}
networks:
- local-network
volumes:
influxdb-storage:
name: influxdb-storage
chronograf-storage:
name: chronograf-storage
grafana-storage:
name: grafana-storage
telegraf-storage:
name: telegraf-storage
networks:
local-network:
driver: bridge
ipam:
driver: default
config:
- subnet: "192.168.22.0/24"
```
nginx configuration v1(ui and api not work:
```
location /influxdb {
proxy_pass http://internal_ip:8086/;
proxy_set_header Host $host;
proxy_set_header X-Real-IP $remote_addr;
proxy_set_header X-Forwarded-For $proxy_add_x_forwarded_for;
proxy_set_header X-Forwarded-Host $server_name;
proxy_set_header X-Forwarded-Proto $scheme;
proxy_set_header X-Forwarded-Prefix /influxdb;
}
```
nginx configuration v2(ui not work. api works):
```
location ~ "^/influxdb/(.*)$" {
proxy_pass http://internal_ip:8086/$1$is_args$args;
proxy_set_header Host $host;
proxy_set_header X-Real-IP $remote_addr;
proxy_set_header X-Forwarded-For $proxy_add_x_forwarded_for;
proxy_set_header X-Forwarded-Host $server_name;
proxy_set_header X-Forwarded-Proto $scheme;
proxy_set_header X-Forwarded-Prefix /influxdb;
}
```
Proof for nginx config v2:
```
curl --request POST "http://graph.domain.com/influxdb/api/v2/write?org=myorg&bucket=_monitoring&precision=ns" --header "Authorization: Token my_token" --header "Content-Type: text/plain; charset=utf-8" --header "Accept: application/json" --data-binary "test test=1 $(date +%s%N)" -w "%{http_code}\n"
204
```
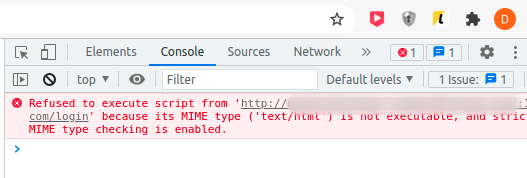
config v2 error:
**Expected behavior:**
Displaying WebUI like a directly connect to service internal_ip:8086
**Actual behavior:**
Blank page
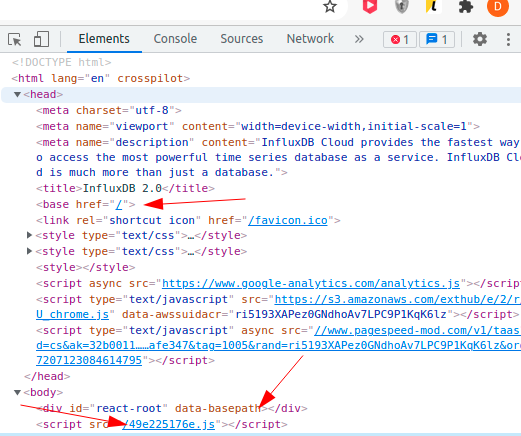
**Visual Proof:**

Contributor guide
No contributing guide indexed for this repository
Assessment
This issue has not been assessed yet.