X Axis doesn't respect the start and stop times of the query (always uses now)
- Dominant language
- TypeScript
- Stars
- 117
- Forks
- 51
- Avg merge
- 2d 15h
- Merged PRs (30d)
- 4
Description
Reposting from idpe 10498:
Example of the issue:
[redacted URL]
No matter what I do, there is no way to get this graph to take up the entire x axis.
Notice the start and stop times in the query and the time range filter are the same, but the graph is still using now for the far right value of the x axis.
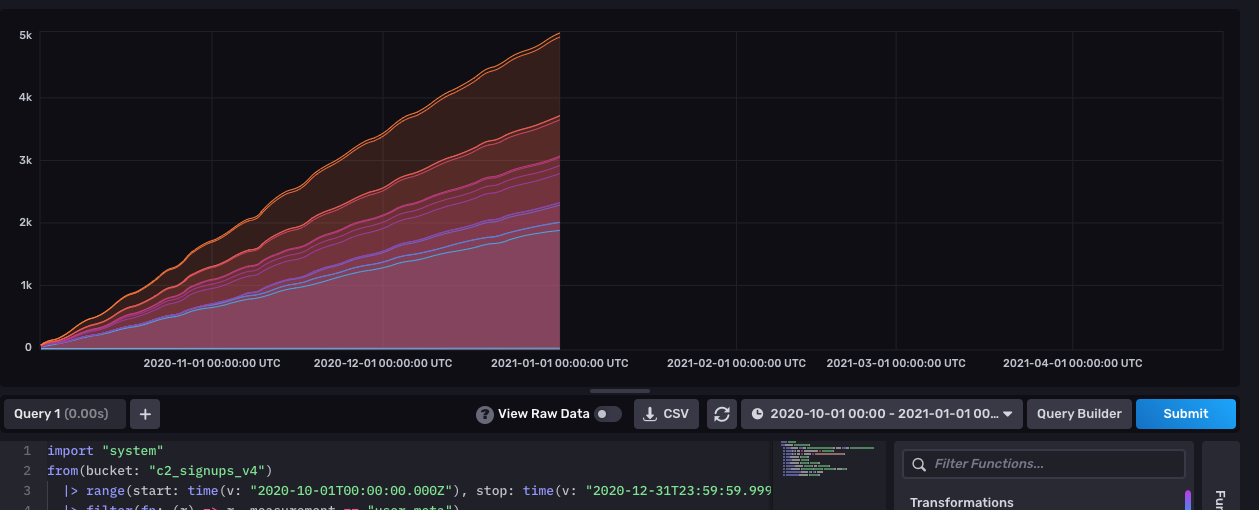
The expectation is that we should use the start and stop time of the query as the x axis domain. If variables are being used, then the time range of the dashboard should be used.
Note that we should NOT use the first and last data point returned. For example, if i have a query that uses the dashboard start and stop time, but only returns 1 point in the past hour, and the dashboard is looking at the past hour, then the start and stop times of the x-axis should be an hour apart.
Contributor guide
No contributing guide indexed for this repository
Assessment
This issue has not been assessed yet.