influxdata / influxdata/telegraf
Proxmox Input Plugin exposes useless fields
- Dominant language
- Go
- Stars
- 17.8k
- Forks
- 5.8k
- Avg merge
- 1d 20h
- Merged PRs (30d)
- 161
Description
## Feature Request
The Proxmox Input Plugin exposes, among others, the following fields:
- disk_used
- disk_total
- disk_free
- disk_used_percentage
It exposes these for every VM running on Proxmox.
The issue is, Proxmox has no idea about disk usage of each VM, because without visibility into the running VM, Proxmox just see's the VM's disk file.
### Proposal:
Report on the Proxmox host storage pool disk stats instead. Proxmox exposes these easily with the `pvesm status` command.
### Current behavior:
The current behaviour gives completely meaningless values for the above metrics. Mostly it just reports back the size of the VM disk image (e.g. raw file size).
### Desired behavior:
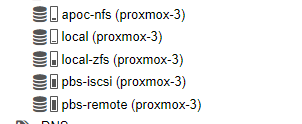
Ditch the above metrics and replace with Proxmox storage pool stats, e.g. these:

### Use case:
I'd like to monitor the storage pool space in Proxmox! This goes for the entire plugin actually, I'd like to monitor Proxmox host stats not just individual VM's running in Proxmox.
Contributor guide
Research direction
Start by locating the Proxmox Input Plugin and reviewing how its current VM disk metrics are collected. Compare that behavior with the values exposed by the `pvesm status` command; done means replacing the misleading per-VM disk fields with Proxmox storage-pool statistics and validating the resulting metrics.
Written by the indexing model from the issue text.
Assessment
- Tech stack
- go
- Domain
- observability
- Issue type
- Feature
- Difficulty
- 4/5
- Estimated time
- 3-5 days
- Activity status
- Stale
- Clarity
- Mostly clear
- Newbie friendliness
- 35/100