influxdata / influxdata/kapacitor
Invalid alerts triggered when pushing batch data to InfluxDB
- Dominant language
- Go
- Stars
- 2.4k
- Forks
- 479
- Avg merge
- 4d 16h
- Merged PRs (30d)
- 4
Description
**Short issue description:**
If two data points are sent to InfluxDB via API, first of which has a value greater than a threshold set in Kapacitor and second that has a value below the set threshold - both data points will pass the alert criteria (even though the second data point shouldn't) and two alerts will be triggered
**Long description (steps to reproduce):**
Given input database: `duplicate_test`, output database `duplicate_test_alerts`, two data points:
```
test_measurement,id=TEST_ID_1 value=90 1608991126
test_measurement,id=TEST_ID_2 value=10 1608911226
```
and with a threshold level set to `50` in following TICK script:
```
var alertName = 'test_alert'
var ALERT_MEASUREMENT = 'test_measurement'
var ALERT_THRESHOLD = 50
var ALERTS_MEASUREMENT_NAME = 'alerts'
var inputDb = 'duplicate_test'
var inputRP = 'autogen'
var outputDb = 'duplicate_test_alerts'
var outputRP = 'autogen'
var whereFilter = lambda: isPresent("value")
var alertId = alertName + '/' + '{{ index .Tags "id" }}'
var messageFieldName = 'message'
var message = '{{ index .Tags "id" }}, measurement: ' + '`' + ALERT_MEASUREMENT + '`' + ' exceeded threshold ' + '{{ index .Fields "value" }} > ' + string(ALERT_THRESHOLD)
var data = stream
|from()
.database(inputDb)
.retentionPolicy(inputRP)
.measurement(ALERT_MEASUREMENT)
.where(whereFilter)
var trigger = data
|alert()
.crit(lambda: "value" > ALERT_THRESHOLD)
.message(message)
.id(alertId)
.messageField(messageFieldName)
|log()
trigger
|influxDBOut()
.create()
.database(outputDb)
.retentionPolicy(outputRP)
.measurement(ALERTS_MEASUREMENT_NAME)
```
After executing write query to InfluxDB:
```
curl --request POST 'http://localhost:8086/write?db=duplicate_test&precision=s' \
--data-raw 'test_measurement,id=TEST_ID_1 value=90 1608991126
test_measurement,id=TEST_ID_2 value=10 1608911226'
```
there are **two** alerts found in output database instead of just **one**:
```
> SELECT * FROM duplicate_test_alerts.autogen.alerts
name: alerts
time id message value
---- -- ------- -----
1608911226000000000 TEST_ID_2 TEST_ID_2, measurement: `test_measurement` exceeded threshold 10 > 50 10
1608991126000000000 TEST_ID_1 TEST_ID_1, measurement: `test_measurement` exceeded threshold 90 > 50 90
>
```
Also, a `|log()` is put just after `alert` node and the log also displays two Kapacitor Points:
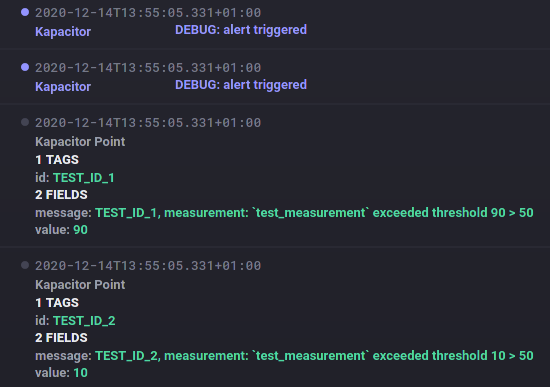
**Expected behavior:**
Only one alert should be triggered / stored (first one)
Anyone had these experiences, or know why this is happening?
This is rather simple use case, but having second alert triggered is strange behavior.
Tested on Kapacitor versions `1.4.1` and `1.5.1` with influxdb: `1.8.3` on linux Manjaro and also on docker images.
Contributor guide
Research direction
Start by reproducing the issue with the supplied TICK script and curl write, then inspect the alert node and its influxDBOut path. Compare the two logged Kapacitor points with the expected single alert and determine where the below-threshold point is incorrectly retained; done means the reproduction stores only the first alert.
Written by the indexing model from the issue text.
Assessment
- Tech stack
- go
- Domain
- observability
- Issue type
- Bug
- Difficulty
- 4/5
- Estimated time
- 3-5 days
- Activity status
- Stale
- Clarity
- Mostly clear
- Newbie friendliness
- 35/100