influxdata / influxdata/kapacitor
memory leak related to task using join node
- Dominant language
- Go
- Stars
- 2.4k
- Forks
- 479
- Avg merge
- 4d 16h
- Merged PRs (30d)
- 4
Description
We are observing a consistent memory leak in Kapacitor. We were running several different types of Tasks, but we isolated the problem down to a single task that uses a Join node. Kapacitor's memory usage continues to grow until the OOM killer targets it and restarts the process (in our case, this restarts the docker container). This pattern repeats itself continuously. The following is a snapshot of the memory usage displayed in Grafana:
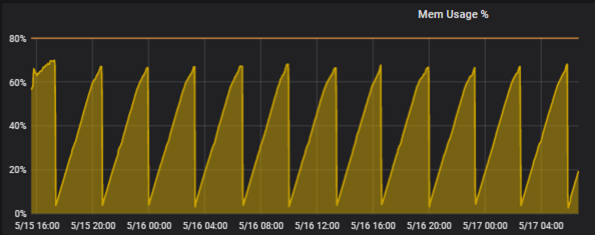
The following are two pprof snapshots showing the top 10 memory uses over a ~20 minute period. During this period the number of data series is constant (there is no change in the number of measurements, tags or tag values).
```
legacy@XXX:~/$ go tool pprof http://localhost:9992/kapacitor/v1/debug/pprof/heap
Fetching profile over HTTP from http://localhost:9992/kapacitor/v1/debug/pprof/heap
Saved profile in /Users/legacy/pprof/pprof.kapacitord.alloc_objects.alloc_space.inuse_objects.inuse_space.032.pb.gz
File: kapacitord
Type: inuse_space
Time: May 22, 2020 at 8:18am (EDT)
Entering interactive mode (type "help" for commands, "o" for options)
(pprof) top
Showing nodes accounting for 36.55MB, 86.81% of 42.10MB total
Showing top 10 nodes out of 126
flat flat% sum% cum cum%
8.50MB 20.20% 20.20% 8.50MB 20.20% github.com/influxdata/kapacitor/vendor/github.com/influxdata/influxdb/models.Tags.Map
7.50MB 17.82% 38.01% 7.50MB 17.82% github.com/influxdata/kapacitor.newJoinset
6.50MB 15.44% 53.46% 6.50MB 15.44% github.com/influxdata/kapacitor/vendor/github.com/influxdata/influxdb/models.(*point).unmarshalBinary
4.50MB 10.69% 64.15% 4.50MB 10.69% strings.(*Builder).WriteString
2.50MB 5.94% 70.09% 2.50MB 5.94% github.com/influxdata/kapacitor/edge.(*pointMessage).ShallowCopy
2.01MB 4.78% 74.87% 9.51MB 22.60% github.com/influxdata/kapacitor.(*joinGroup).Collect
1.52MB 3.62% 78.49% 1.52MB 3.62% github.com/influxdata/kapacitor/edge.NewChannelEdge
1.50MB 3.56% 82.05% 2.50MB 5.94% github.com/influxdata/kapacitor/edge.NewBeginBatchMessage
1MB 2.39% 84.44% 1MB 2.39% github.com/influxdata/kapacitor/tick/stateful.NewFunctions
1MB 2.38% 86.81% 1MB 2.38% github.com/influxdata/kapacitor/vendor/github.com/influxdata/influxdb/models.(*point).Name
(pprof) exit
```
```
legacy@XXX:~/$ go tool pprof http://localhost:9992/kapacitor/v1/debug/pprof/heap
Fetching profile over HTTP from http://localhost:9992/kapacitor/v1/debug/pprof/heap
Saved profile in /Users/legacy/pprof/pprof.kapacitord.alloc_objects.alloc_space.inuse_objects.inuse_space.033.pb.gz
File: kapacitord
Type: inuse_space
Time: May 22, 2020 at 8:39am (EDT)
Entering interactive mode (type "help" for commands, "o" for options)
(pprof) top
Showing nodes accounting for 60.55MB, 88.24% of 68.62MB total
Showing top 10 nodes out of 140
flat flat% sum% cum cum%
16.50MB 24.05% 24.05% 16.50MB 24.05% github.com/influxdata/kapacitor/vendor/github.com/influxdata/influxdb/models.Tags.Map
12MB 17.49% 41.54% 12MB 17.49% github.com/influxdata/kapacitor/vendor/github.com/influxdata/influxdb/models.(*point).unmarshalBinary
12MB 17.49% 59.03% 12MB 17.49% github.com/influxdata/kapacitor.newJoinset
8.50MB 12.39% 71.42% 8.50MB 12.39% strings.(*Builder).WriteString
4MB 5.83% 77.25% 4MB 5.83% github.com/influxdata/kapacitor/edge.(*pointMessage).ShallowCopy
2.50MB 3.64% 80.89% 5MB 7.29% github.com/influxdata/kapacitor/edge.NewBeginBatchMessage
1.52MB 2.22% 83.12% 1.52MB 2.22% github.com/influxdata/kapacitor/edge.NewChannelEdge
1.50MB 2.19% 85.30% 1.50MB 2.19% github.com/influxdata/kapacitor/vendor/github.com/influxdata/influxdb/models.(*point).Name
1.01MB 1.48% 86.78% 13.02MB 18.97% github.com/influxdata/kapacitor.(*joinGroup).Collect
1MB 1.46% 88.24% 1MB 1.46% github.com/influxdata/kapacitor/tick/stateful.NewFunctions
(pprof)
```
This is the template that the tasks are based on that are causing the issue:
```
var database = 'XXX'
var target_measurement string
var actual_measurement string
var result_measurement string
var window_size = 15s
var target = stream
|from()
.measurement(target_measurement)
.groupBy('*')
var actual = stream
|from()
.measurement(actual_measurement)
.groupBy('*')
var data = actual
|join(target)
.as('actual', 'target')
.tolerance(window_size)
.fill('null')
|default()
.field('actual.value', 999.99)
.field('target.value', 999.99)
|where(lambda: "actual.value" != 999.99 AND "target.value" != 999.99)
data
|eval(lambda: "target.value" - "actual.value")
.as('value')
|influxDBOut()
.measurement(result_measurement)
.database(database)
.create()
```
This is the DOT graph portion of the "show" operation:
```
DOT:
digraph MyTask {
graph [throughput="0.00 points/s"];
stream0 [avg_exec_time_ns="0s" errors="0" working_cardinality="0" ];
stream0 -> from2 [processed="23380"];
stream0 -> from1 [processed="23380"];
from2 [avg_exec_time_ns="0s" errors="0" working_cardinality="0" ];
from2 -> join4 [processed="18240"];
from1 [avg_exec_time_ns="0s" errors="0" working_cardinality="0" ];
from1 -> join4 [processed="5140"];
join4 [avg_exec_time_ns="0s" errors="0" working_cardinality="59" ];
join4 -> default5 [processed="3198"];
default5 [avg_exec_time_ns="0s" errors="0" fields_defaulted="1356" tags_defaulted="0" working_cardinality="0" ];
default5 -> where6 [processed="3198"];
where6 [avg_exec_time_ns="0s" errors="0" working_cardinality="8" ];
where6 -> log7 [processed="1842"];
log7 [avg_exec_time_ns="0s" errors="0" working_cardinality="0" ];
log7 -> eval8 [processed="1842"];
eval8 [avg_exec_time_ns="0s" errors="0" working_cardinality="8" ];
eval8 -> influxdb_out9 [processed="1842"];
influxdb_out9 [avg_exec_time_ns="0s" errors="0" points_written="1842" working_cardinality="0" write_errors="0" ];
```
version: 1.5.4
Docker for Mac: 2.0.0.0-mac81 (but also happens on CentOS 7.7 with Docker 18.09.8)
Contributor guide
Research direction
Start by reproducing the reported task with the Join node and collecting heap profiles from /kapacitor/v1/debug/pprof/heap. Read newJoinset and joinGroup.Collect, which appear in the profiles, and compare allocations while the series count remains constant. Done means identifying and fixing the leak and demonstrating stable memory usage with a regression test.
Written by the indexing model from the issue text.
Assessment
- Tech stack
- docker, go
- Domain
- backend, stream-processing
- Issue type
- Bug
- Difficulty
- 4/5
- Estimated time
- 3-5 days
- Activity status
- Stale
- Clarity
- Needs clarification
- Newbie friendliness
- 35/100