influxdata / influxdata/kapacitor
Stream delay & memory growing
- Dominant language
- Go
- Stars
- 2.4k
- Forks
- 479
- Avg merge
- 4d 16h
- Merged PRs (30d)
- 4
Description
Hi
I notice stream delay on getting points from InfluxDB. For 12 hours after starting kapacitor I have about 5h delay of points.
In Influx I have about 500k points writes(over UDP) every 10 minutes and kapacitor is subscribed to this measurement.
My TICK script:
```
ID: prices
Error:
Template:
Type: stream
Status: enabled
Executing: true
Created: 22 Aug 19 11:55 UTC
Modified: 07 Sep 19 18:36 UTC
LastEnabled: 07 Sep 19 18:36 UTC
Databases Retention Policies: ["prices"."one_hour"]
TICKscript:
dbrp "prices"."one_hour"
var prices = stream
|from()
.measurement('hourly_prices')
.groupBy('product_id')
|window()
.period(20m)
.every(10m)
.align()
|derivative('value')
.unit(10m)
.as('derivative')
|alert()
.warn(lambda: "derivative" != 0)
.message('')
.details('')
.post('SOME_URL')
DOT:
digraph good_price {
graph [throughput="534.02 points/s"];
stream0 [avg_exec_time_ns="0s" errors="0" working_cardinality="0" ];
stream0 -> from1 [processed="23358734"];
from1 [avg_exec_time_ns="34.372µs" errors="0" working_cardinality="0" ];
from1 -> window2 [processed="23357733"];
window2 [avg_exec_time_ns="38.578µs" errors="0" working_cardinality="509909" ];
window2 -> derivative3 [processed="11735431"];
derivative3 [avg_exec_time_ns="22.148µs" errors="0" working_cardinality="506690" ];
derivative3 -> alert4 [processed="11734430"];
alert4 [alerts_inhibited="0" alerts_triggered="49859" avg_exec_time_ns="10.217857ms" crits_triggered="0" errors="0" infos_triggered="0" oks_triggered="21210" warns_triggered="28649" working_cardinality="506687" ];
}
```
Also I see memory growing
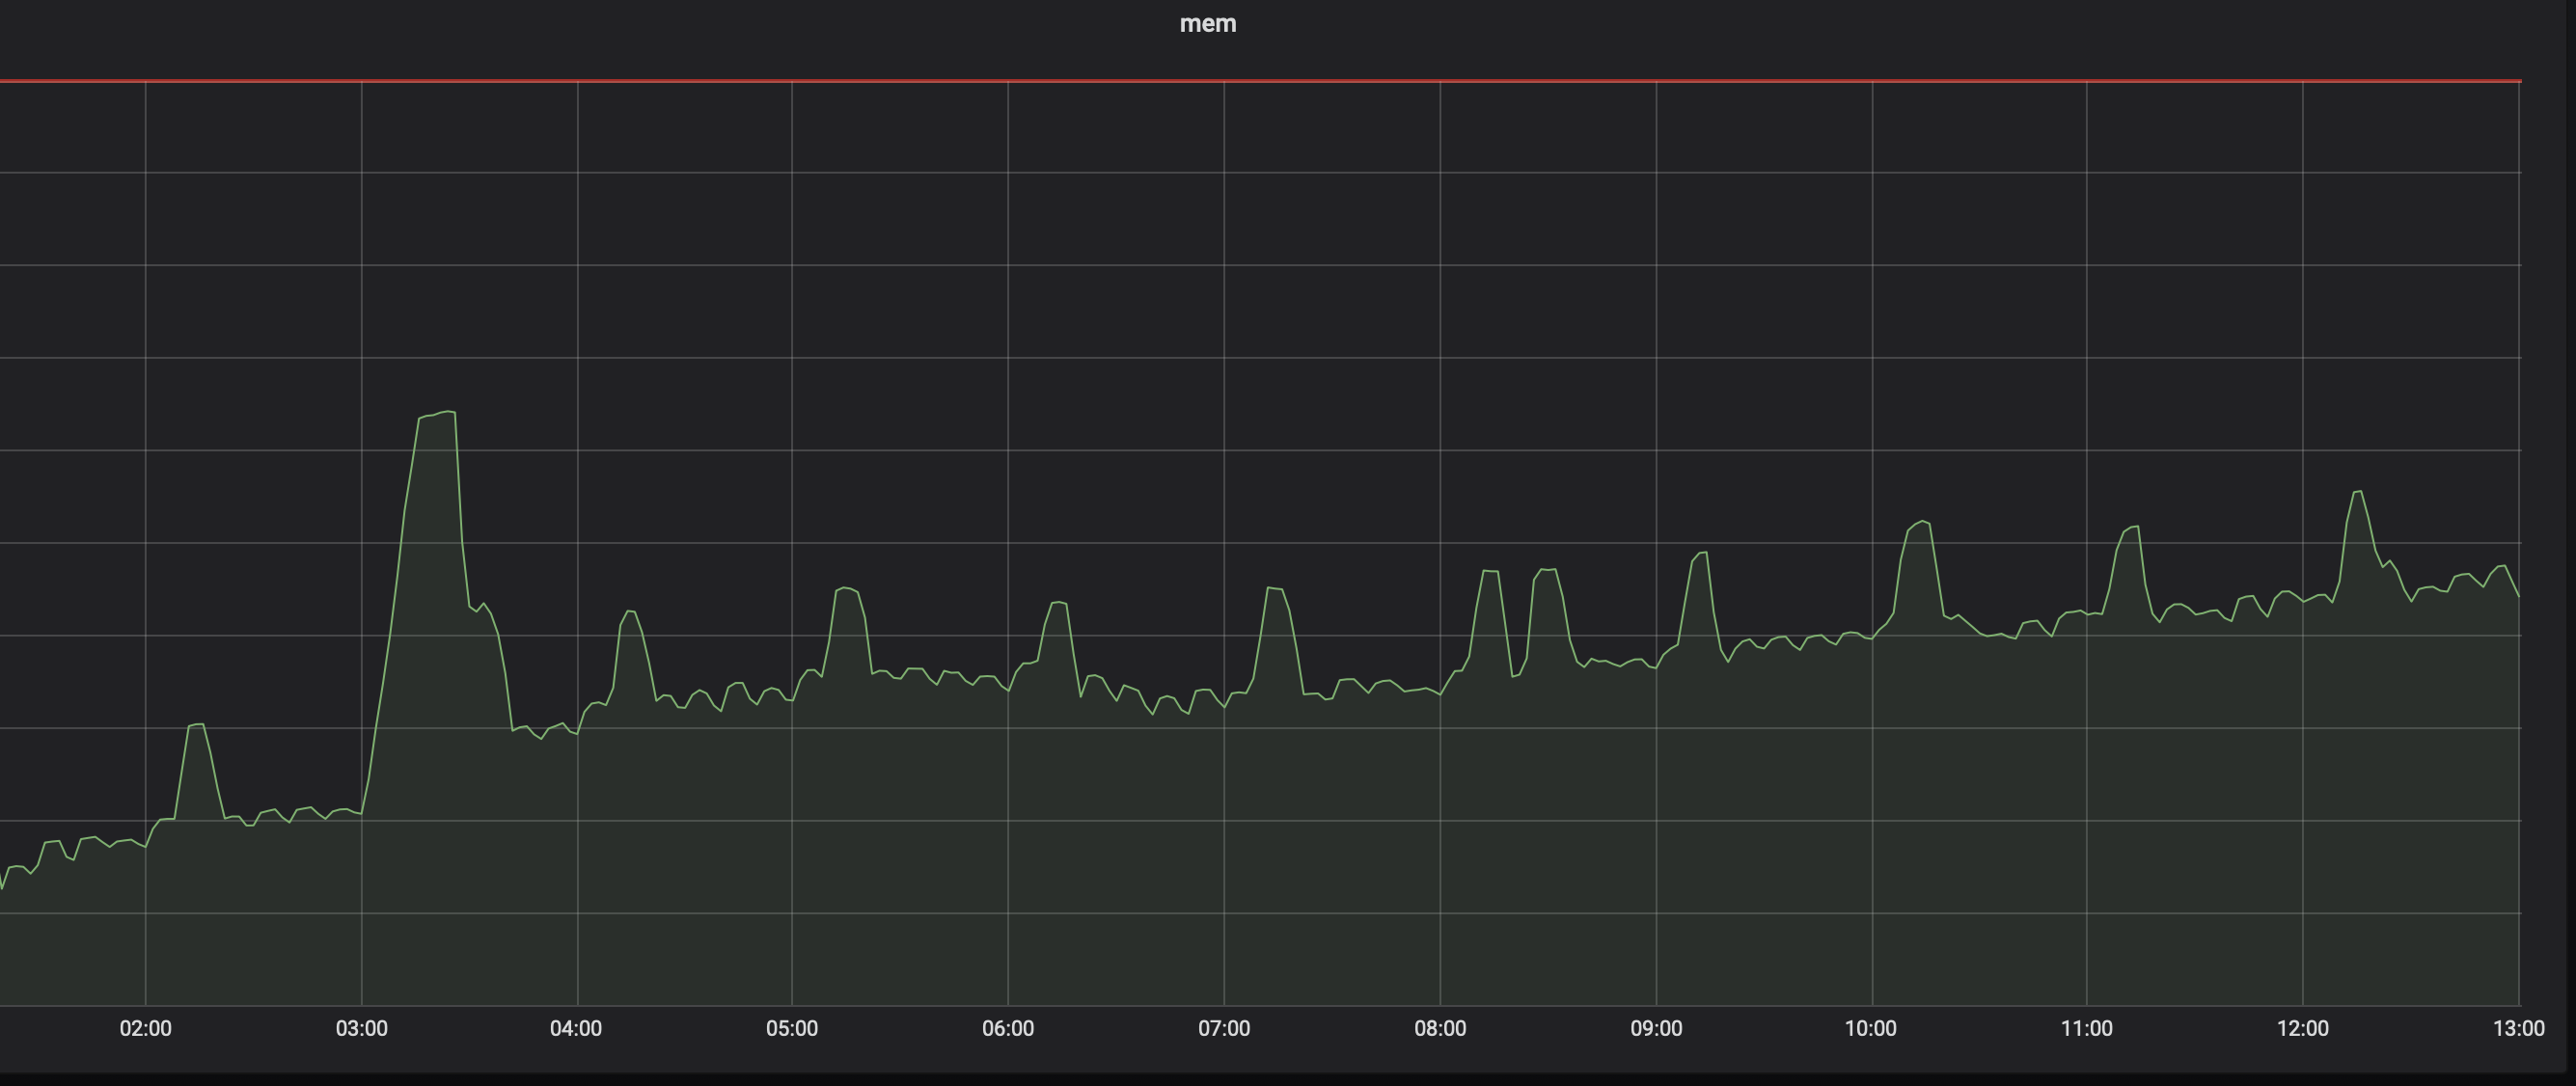
Also: When Kapacitor starts “write/consistency” queries from influx to kapacitor goes very fast (about some milliseconds) and over time they take more time and as result I get this logs:
```
ts=2019-09-11T10:05:22.998Z lvl=info msg="http request" service=http host=MY_IP username=- start=2019-09-11T04:02:40.725267403Z method=POST uri=/write?consistency=&db=catalog_prices&precision=ns&rp=one_hour protocol=HTTP/1.1 status=204 referer=- user-agent=InfluxDBClient request-id=ffe21ac7-d448-11e9-91c1-000000000000 duration=6h2m42.273459373s
```
```
ts=2019-09-11T10:03:32.484558Z lvl=info msg="Post http://HOST:9092/write?consistency=&db=catalog_prices&precision=ns&rp=one_hour: net/http: request canceled (Client.Timeout exceeded while awaiting headers)" log_id=0Hnq3osG000 service=subscriber
```
I use Kapacitor and InflxuDB in docker container on same physical machine with host net. Here my versions:
Kapacitor 1.5.3
InfluxDB 1.7.7
Ubuntu 16.04.6 LTS
What I'm doing wrong?
Contributor guide
Research direction
Start with the provided TICKscript, DOT output, and Kapacitor subscriber logs, focusing on window cardinality, throughput, memory growth, and increasingly long /write requests. Reproduce or inspect the workload described for Kapacitor 1.5.3 and InfluxDB 1.7.7; done would mean identifying the cause of the delay and memory growth and documenting a verified correction or configuration change.
Written by the indexing model from the issue text.
Assessment
- Tech stack
- go
- Domain
- databases, observability, stream-processing
- Issue type
- Bug
- Difficulty
- 4/5
- Estimated time
- 3-5 days
- Activity status
- Stale
- Clarity
- Needs clarification
- Newbie friendliness
- 25/100