influxdata / influxdata/kapacitor
High CPU usage with no TICK scripts
- Dominant language
- Go
- Stars
- 2.4k
- Forks
- 479
- Avg merge
- 4d 16h
- Merged PRs (30d)
- 4
Description
Our monitoring stack consists of 2 availability zones each with an instance (`r4.large`) running kapacitor. Both run kapacitor 24x7, but only one is ever the primary with our TICK scripts enabled while the other is running with no tasks. We have automation that runs every 5 minutes to handle who is the primary and if the primary has failed or the instance was terminated, we add and enable the TICK scripts on the secondary.
The issue we are experiencing is that the instance in one of our availability zones constantly has a higher CPU usage than our other instance, regardless of whether it is running the TICK scripts or not. We've isolated the issue to be kapacitor using an unacceptable amount of CPU, but cannot determine why. Debug logging does not output anything other than `lvl=debug msg="linking subscription for cluster" service=influxdb cluster=localhost cluster=localhost` every minute. We have also tried terminating and bringing up new instances in its place several times with no change.
The 2 instances are mostly identical. The exact same AMI, same version of kapacitor (1.5.0), the same configuration files which are shared via EFS. The only difference we can tell is the availability zone they exist.
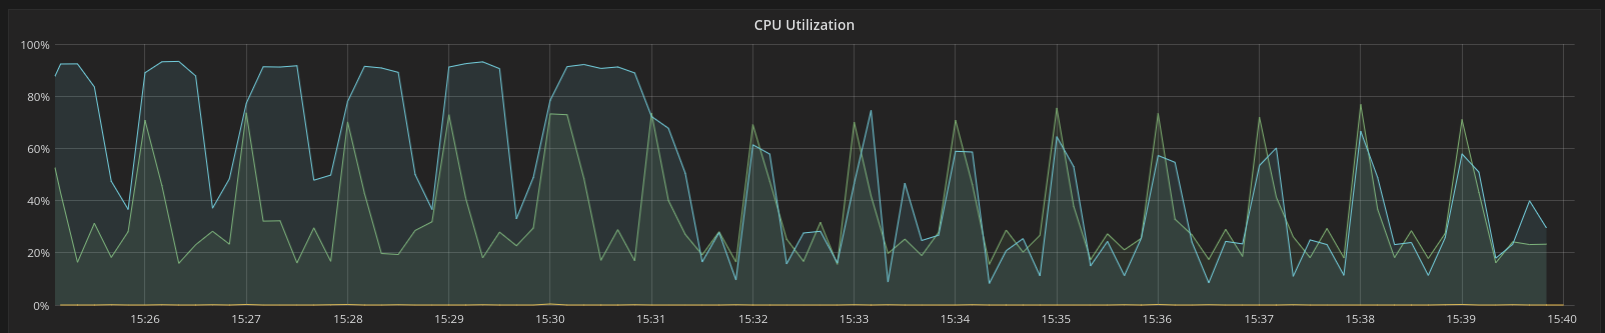
Below is a screenshot of our monitoring of the CPU usage on the 2 instances. The blue is our problematic machine and the green is the normal, primary machine. In this case, the green is running our TICK scrips while the blue has none enabled. The drop in usage for blue at around 15:31 is when we disable kapacitor on the secondary machine. Once this is disabled, you can see the usage drops to mirror what the primary is doing.
Please let me know if you need any more information. We have tried everything and are unable to determine what is causing this high kapacitor usage.
Contributor guide
Research direction
Start by comparing the two Kapacitor 1.5.0 instances, including their shared configuration, availability zones, enabled tasks, and debug output. Reproduce the CPU difference with no TICK scripts and compare it with the drop seen when Kapacitor is disabled. Done means identifying and explaining the cause of the unexplained CPU usage.
Written by the indexing model from the issue text.
Assessment
- Tech stack
- go
- Domain
- observability
- Issue type
- Bug
- Difficulty
- 4/5
- Estimated time
- 3-5 days
- Activity status
- Stale
- Clarity
- Needs clarification
- Newbie friendliness
- 25/100