influxdata / influxdata/kapacitor
stream work abnormal
- Dominant language
- Go
- Stars
- 2.4k
- Forks
- 479
- Avg merge
- 4d 16h
- Merged PRs (30d)
- 4
Description
my source data like {"uid":xxxx,"reason":x,"time":xxxxx}
the _reason_ stands for the specified abnormal situation that cause offline to a user (uid)
I gather those data in influxdb and it works well.
and I wanna get the sum value of each reason for every 60 seconds and do some alarm job.so I write tick script:
```
dbrp "ClientMetrics"."30daysrp"
var db = 'ClientMetrics'
var rp = '30daysrp'
var measurement = 'NetStat'
var groupBy = []
var period = 60s
var every = 60s
var outputDB = 'ClientOverview'
var outputRP = '180daysrp'
var outputMeasurement = 'NetStatOverview'
var data = stream
|from()
.database(db)
.retentionPolicy(rp)
.measurement(measurement)
.groupBy(groupBy)
.where(lambda: "reason" == 4)
|window()
.period(period)
.every(every)
.align()
|sum('reason')
.as('value')
var trigger = data
|influxDBOut()
.create()
.database(outputDB)
.retentionPolicy(outputRP)
.measurement(outputMeasurement)
.tag('specificReasonSum', 'reason4')
```
in first step,I wanna gather reason 4 and reason 7
then, a problem occured (for reason4)
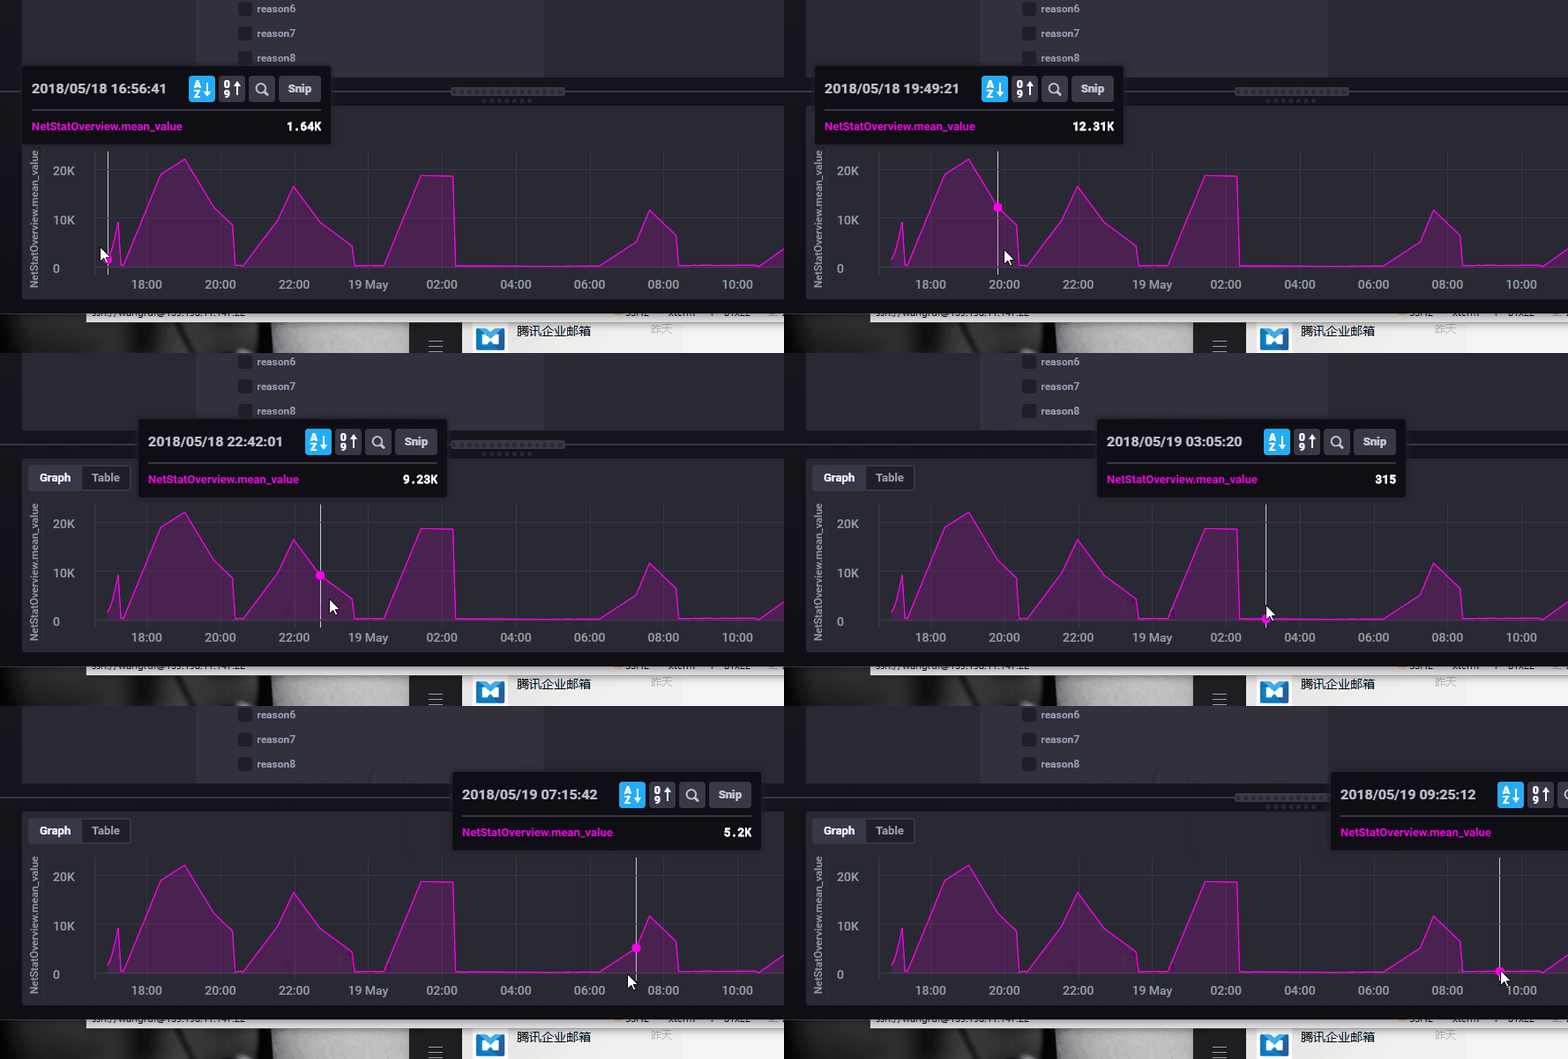
it seems that the job will work normally for serveral minutes or hours,and then it will get stuck for hours and repeat this circle.
but the really strange part is other kapacitor job(for reason7 ) looks well functionally
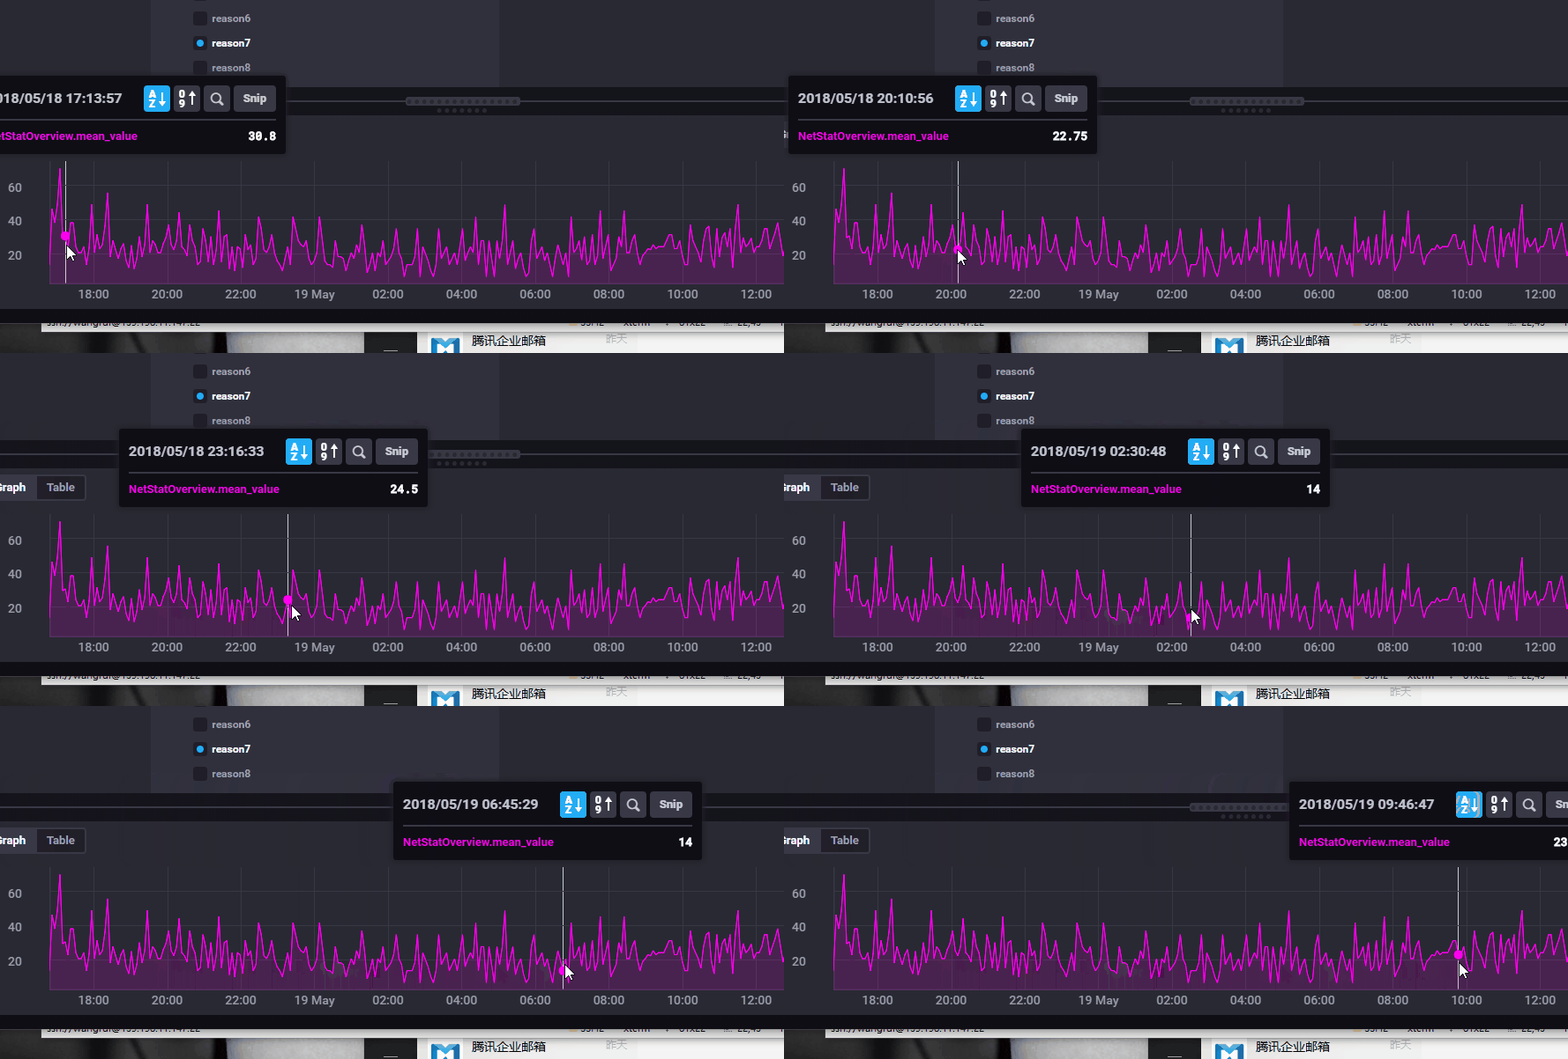
I need those data in-time for alarm. so how to solve them?
by the way,the sum of reason 4 in a minute is in range of 200 between 300
the reason 7 is more rare than reason 4 (you can see in the last gif,about 20 times a minute)
Contributor guide
Research direction
Start with the posted tick script, especially the reason4 stream using window(), sum(), and influxDBOut(), and compare its behavior with the reason7 job. Reproduce the intermittent multi-hour stalls and inspect the one-minute output timing; done means the reason4 job processes continuously and provides timely alarm data.
Written by the indexing model from the issue text.
Assessment
- Tech stack
- go
- Domain
- databases, observability, stream-processing
- Issue type
- Bug
- Difficulty
- 4/5
- Estimated time
- 3-5 days
- Activity status
- Stale
- Clarity
- Needs clarification
- Newbie friendliness
- 20/100