influxdata / influxdata/influxdb
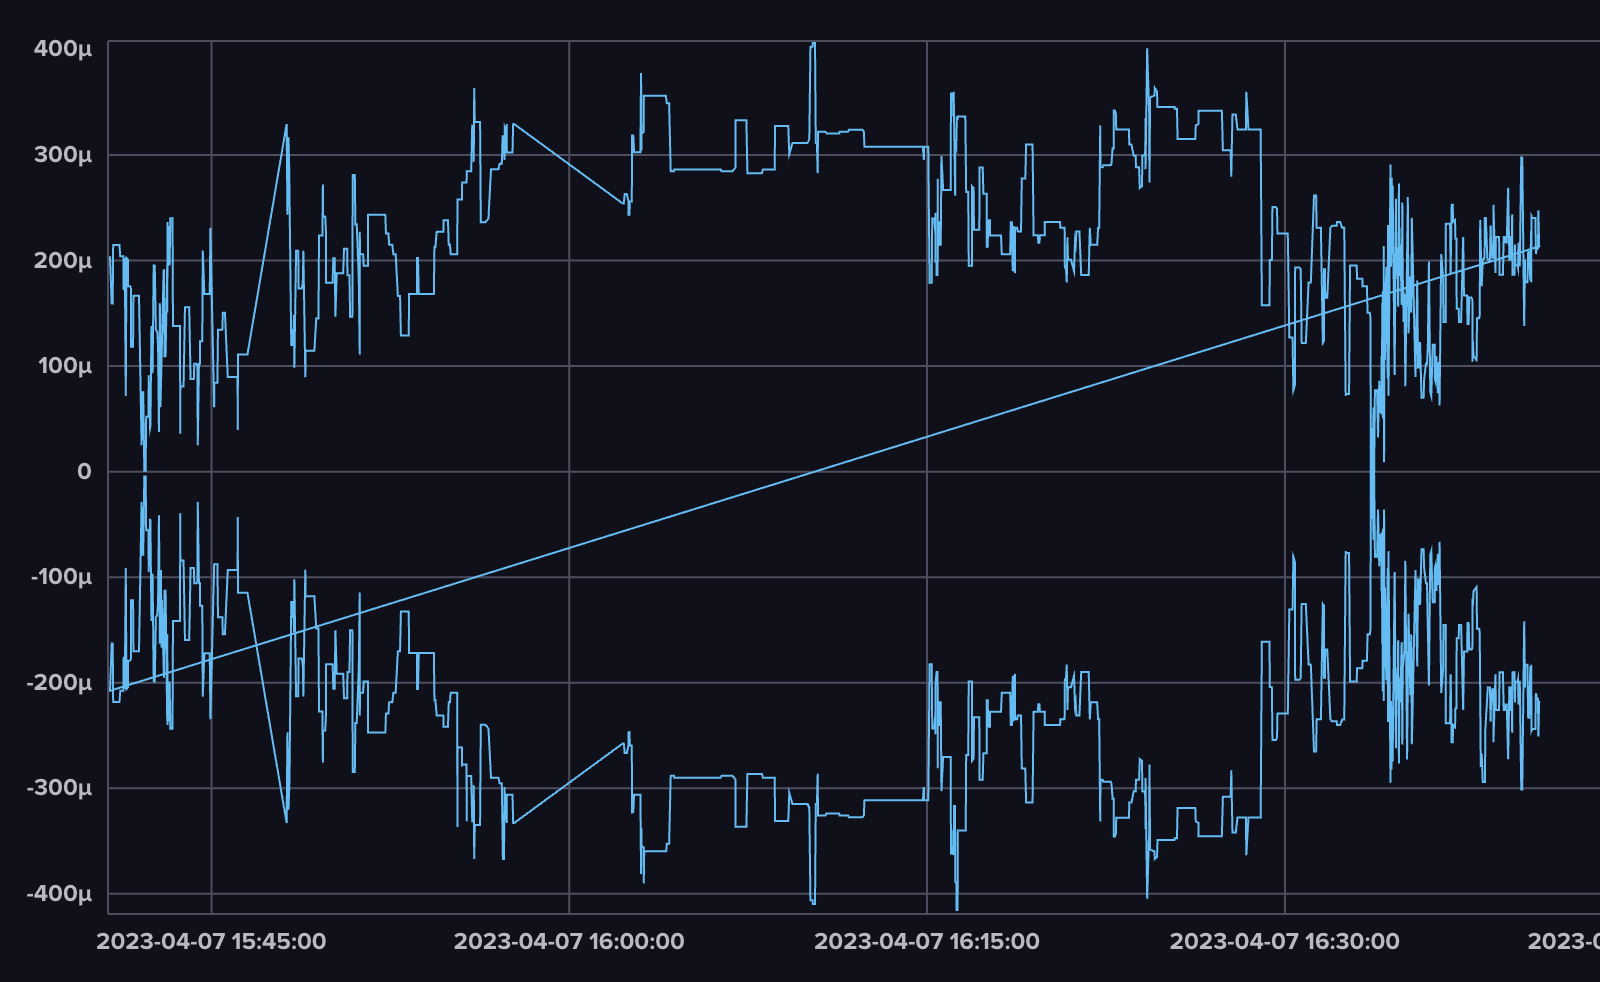
Weird Graph if they have same tag value
- Dominant language
- Rust
- Stars
- 31.7k
- Forks
- 3.7k
- Avg merge
- 13h 37m
- Merged PRs (30d)
- 8
Description
If I have data that contains `tagA=someValue1,tagB=someValue2` and `tagA=someValue2,tagB=someValue1`, the quried `Raw Data` has
| table | _field | _value | tagA | tagB |
|------|-------|----------|------|----|
|0 | field_name | field_val1 | someValue1 | someValue2|
|0 | field_name | field_val2 | someValue1 | someValue2|
|0 | field_name | field_val3 | someValue1 | someValue2|
|1 | field_name | field_val1 | someValue2 | someValue1|
|1 | field_name | field_val2 | someValue2 | someValue1|
|1 | field_name | field_val3 | someValue2 | someValue1|
but when it goes to graph, there is juse one line, just like
Contributor guide
Research direction
No source file, test, or entry point is identified. Reproduce the reported Raw Data and graph combination with the two tag pairs, then trace how the rows become graph series. Done means both distinct tag combinations render as separate lines rather than one combined line.
Written by the indexing model from the issue text.
Assessment
- Domain
- data-visualization
- Issue type
- Bug
- Difficulty
- 3/5
- Estimated time
- 1-2 days
- Activity status
- Stale
- Clarity
- Needs clarification
- Newbie friendliness
- 32/100