influxdata / influxdata/influxdb
Influxdb 2.6.1 memory allocation at night then crash
Nobody has claimed this yet.
- Dominant language
- Rust
- Stars
- 31.7k
- Forks
- 3.7k
- Avg merge
- 13h 37m
- Merged PRs (30d)
- 8
Description
Hi Guys,
I have this issue every X days/weeks, and I have no idea what is doing this.
Only a restart of Influx makes it receivable for requests again.
I have eliminated the following by disabling.
Server backup jobs
Anti Virus Software
Windows Updates
Scripts using the influx API
Grafana alerts/request
Cardinality is fine and I have no queries without TimeFilter on.
Retention is set to 30 days for the bucket.
And I never delete measurements manually or via api
Running on Windows 2022, and previously also 2012 R2
InfluxDB v2.6.1 (git: 9dcf880fe0) build_date: 2022-12-29T15:53:06Z
Running vanilla, no config additions
this is the log from the latest crash, it's a couple of lines right before the first message "internal error".
full log can be provided, but i can't see anything else than repeating "internal error"
ts=2023-03-08T19:51:12.328563Z lvl=debug msg=Request log_id=0gLsOB_0000 service=http method=GET host=adm-grafana.bygma.dk:8086 path=/query query="db=Telegraf&epoch=ms&q=SELECT+state+FROM+%22win_services%22+WHERE+time+%3E%3D+now%28%29+-+6h+and+time+%3C%3D+now%28%29+and+display_name+%21%3D+%27SQL+Server+%28SOLITWORK%29%27+GROUP+BY+host%2C+display_name+" proto=HTTP/1.1 status_code=200 response_size=14924 content_length=0 referrer= remote=[fe80::2778:32d3:3bda:f0f%Ethernet0]:57006 user_agent=Grafana took=67.400ms body=
ts=2023-03-08T19:51:12.917527Z lvl=debug msg="user find by ID" log_id=0gLsOB_0000 store=new took=0.000ms
ts=2023-03-08T19:51:12.918062Z lvl=debug msg="org find" log_id=0gLsOB_0000 store=new took=0.000ms
ts=2023-03-08T19:51:12.918062Z lvl=debug msg="bucket find" log_id=0gLsOB_0000 store=new took=0.000ms
ts=2023-03-08T19:51:12.920769Z lvl=debug msg=Request log_id=0gLsOB_0000 service=http method=POST host=adm-grafana.bygma.dk:8086 path=/api/v2/write query="bucket=Telegraf&org=Bygma" proto=HTTP/1.1 status_code=204 response_size=0 content_length=-1 referrer= remote=[fe80::2778:32d3:3bda:f0f%Ethernet0]:60495 user_agent=Go took=3.242ms
ts=2023-03-08T19:51:17.084599Z lvl=debug msg="user find by ID" log_id=0gLsOB_0000 store=new took=0.000ms
ts=2023-03-08T19:51:17.093771Z lvl=debug msg="org find" log_id=0gLsOB_0000 store=new took=0.000ms
ts=2023-03-08T19:51:17.093771Z lvl=debug msg="bucket find" log_id=0gLsOB_0000 store=new took=0.000ms
ts=2023-03-08T19:51:17.096453Z lvl=debug msg=Request log_id=0gLsOB_0000 service=http method=POST host=adm-grafana.bygma.dk:8086 path=/api/v2/write query="bucket=Telegraf&org=Bygma" proto=HTTP/1.1 status_code=204 response_size=0 content_length=-1 referrer= remote=10.1.223.69:49692 user_agent=Telegraf took=11.854ms
ts=2023-03-08T19:51:18.246168Z lvl=debug msg="buckets find" log_id=0gLsOB_0000 store=new took=0.000ms
ts=2023-03-08T19:51:18.249876Z lvl=debug msg=Request log_id=0gLsOB_0000 service=http method=POST host=adm-grafana.bygma.dk:8086 path=/api/v2/write query="bucket=Telegraf&org=Bygma" proto=HTTP/1.1 status_code=499 response_size=107 content_length=-1 referrer= remote=10.1.222.26:55651 user_agent=Telegraf took=11211.890ms error="internal error" error_code="internal error"
ts=2023-03-08T19:51:21.024895Z lvl=debug msg=Request log_id=0gLsOB_0000 service=http method=GET host=localhost:8086 path=/metrics query= proto=HTTP/1.1 status_code=200 response_size=73035 content_length=0 referrer= remote=[::1]:60496 user_agent=Go-http-client took=40.419ms body=
ts=2023-03-08T19:51:22.129658Z lvl=debug msg="user find by ID" log_id=0gLsOB_0000 store=new took=0.000ms
ts=2023-03-08T19:51:22.129658Z lvl=debug msg="org find" log_id=0gLsOB_0000 store=new took=0.000ms
ts=2023-03-08T19:51:22.129658Z lvl=info msg="executing new query" log_id=0gLsOB_0000 query="SELECT mean("Percent_Processor_Time") FROM "win_cpu" WHERE ("host" = 'BISQL02') AND time >= now() - 24h and time <= now() GROUP BY time(15m) fill(null)"
ts=2023-03-08T19:51:22.129658Z lvl=debug msg="buckets find" log_id=0gLsOB_0000 store=new took=0.000ms
ts=2023-03-08T19:51:22.129658Z lvl=info msg="Executing query" log_id=0gLsOB_0000 service=query query="SELECT mean(Percent_Processor_Time) FROM Telegraf.autogen.win_cpu WHERE (host = 'BISQL02') AND time >= now() - 1d AND time <= now() GROUP BY time(15m)"
ts=2023-03-08T19:51:22.130196Z lvl=debug msg="buckets find" log_id=0gLsOB_0000 store=new took=0.000ms
My setup is
Telegraf
Influx
Grafana
I have had this issue for a couple of years now, and went from influx 1.x to now 2.6.1, upgrading every couple of months to try and fix this.
Also upgrading Telegraf and Grafana everytime.
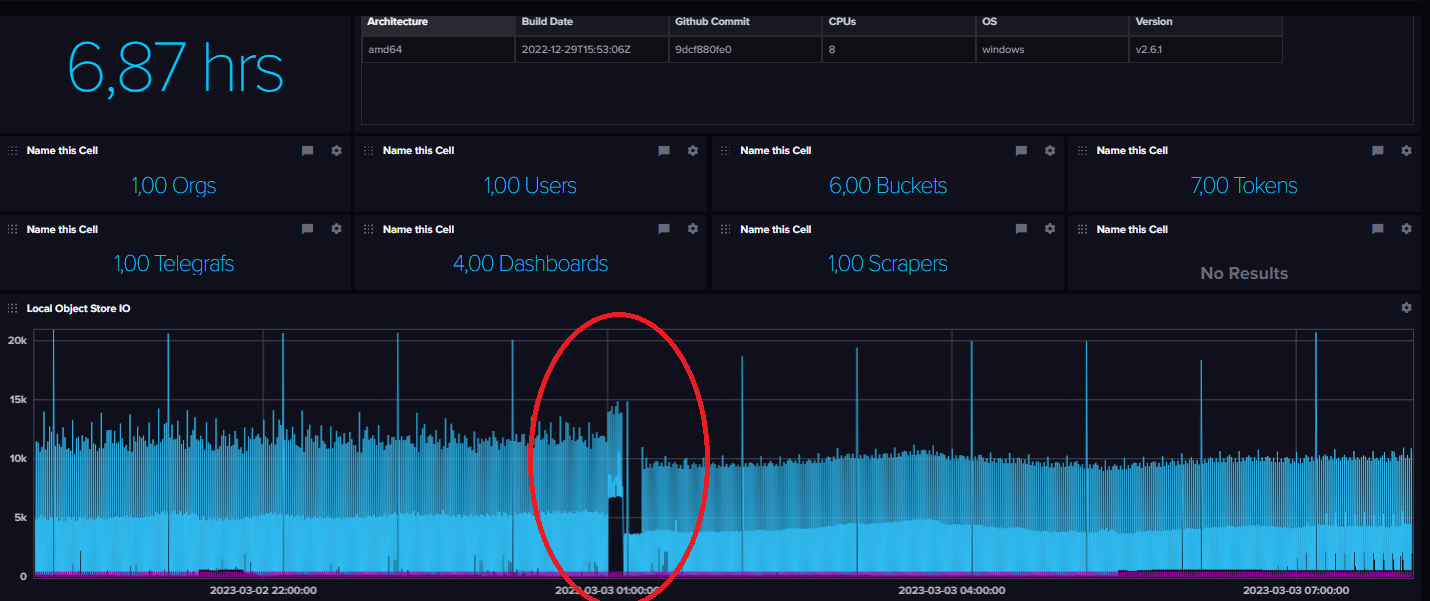
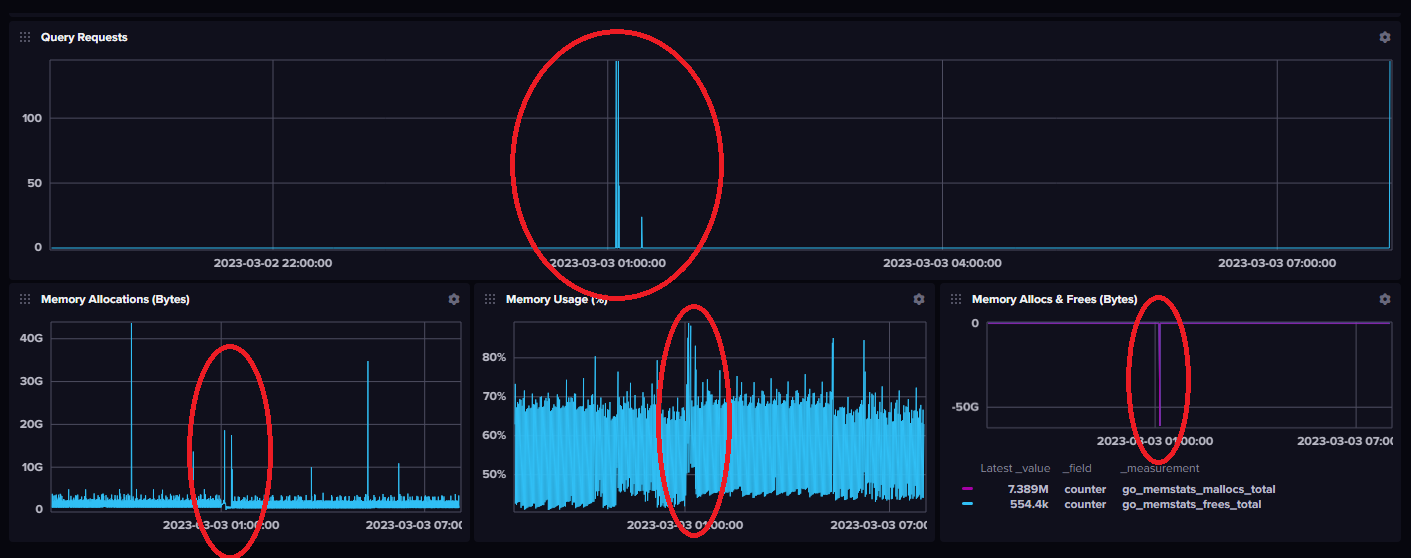
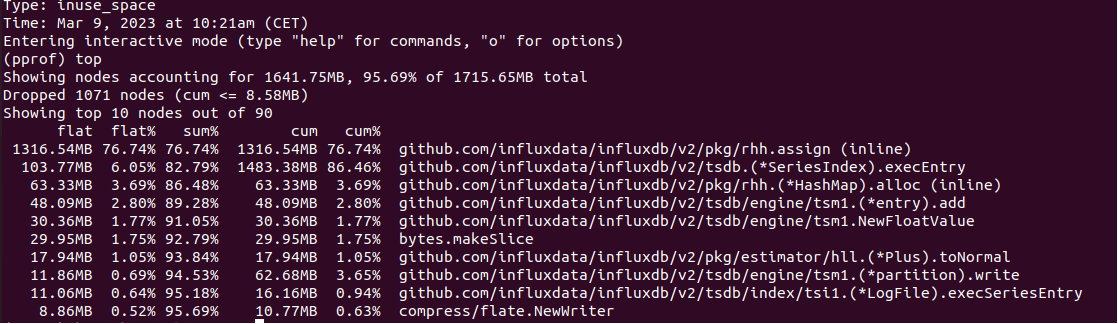
This is a profile from when it's running find during the daytime.
allocs
Best regards
Contributor guide
First steps
- Read the whole issue, then the project's contributing guide.
- Comment on the issue to say you are picking it up — it saves two people doing the same work.
- Fork the repository and make your change on a branch.
- Open a pull request that references the issue number.
Research direction
No source file or test is identified. Start by reproducing the recurring memory spike on Windows with the listed Telegraf and Grafana setup, then collect the full logs and a profile around the crash and compare them with the daytime profile. Done means the failure has a reproducible cause and a confirmed fix or narrowly scoped follow-up.
Written by the indexing model from the issue text.
Assessment
- Domain
- databases, observability
- Issue type
- Bug
- Difficulty
- 5/5
- Estimated time
- Over a week
- Activity status
- Stale
- Clarity
- Needs clarification
- Newbie friendliness
- 20/100