influxdata / influxdata/influxdb
Check status fails to trigger conditions and does not log alert history
- Dominant language
- Rust
- Stars
- 31.7k
- Forks
- 3.7k
- Avg merge
- 13h 37m
- Merged PRs (30d)
- 8
Description
__Steps to reproduce:__
List the minimal actions needed to reproduce the behavior.
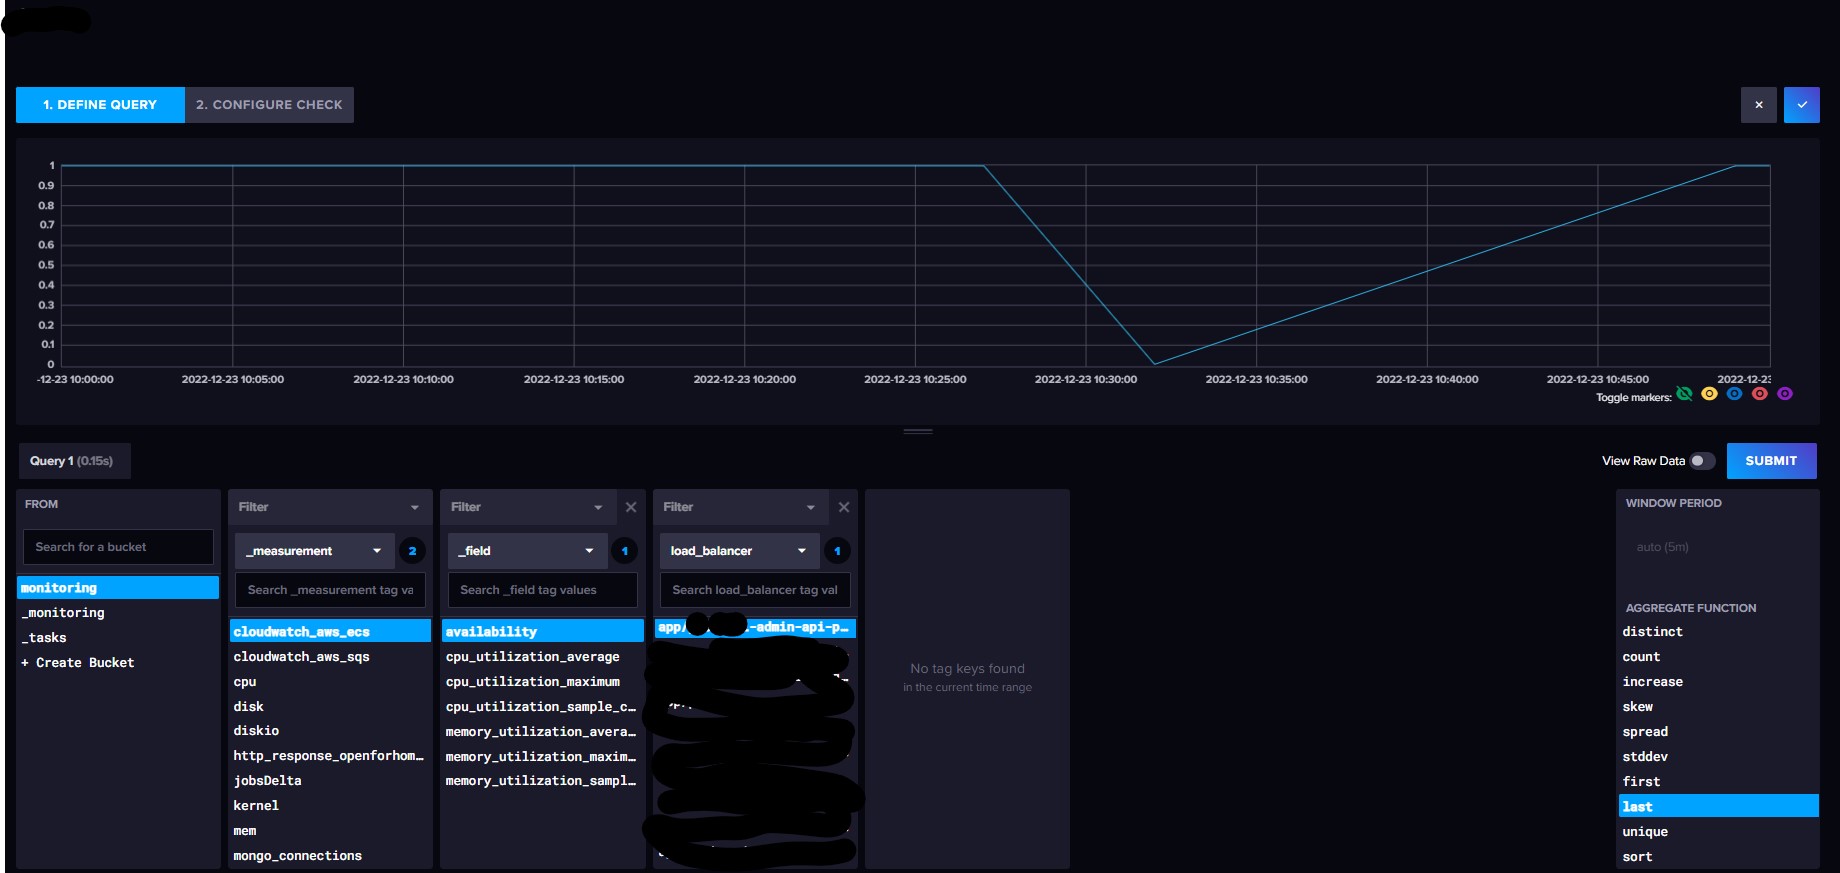
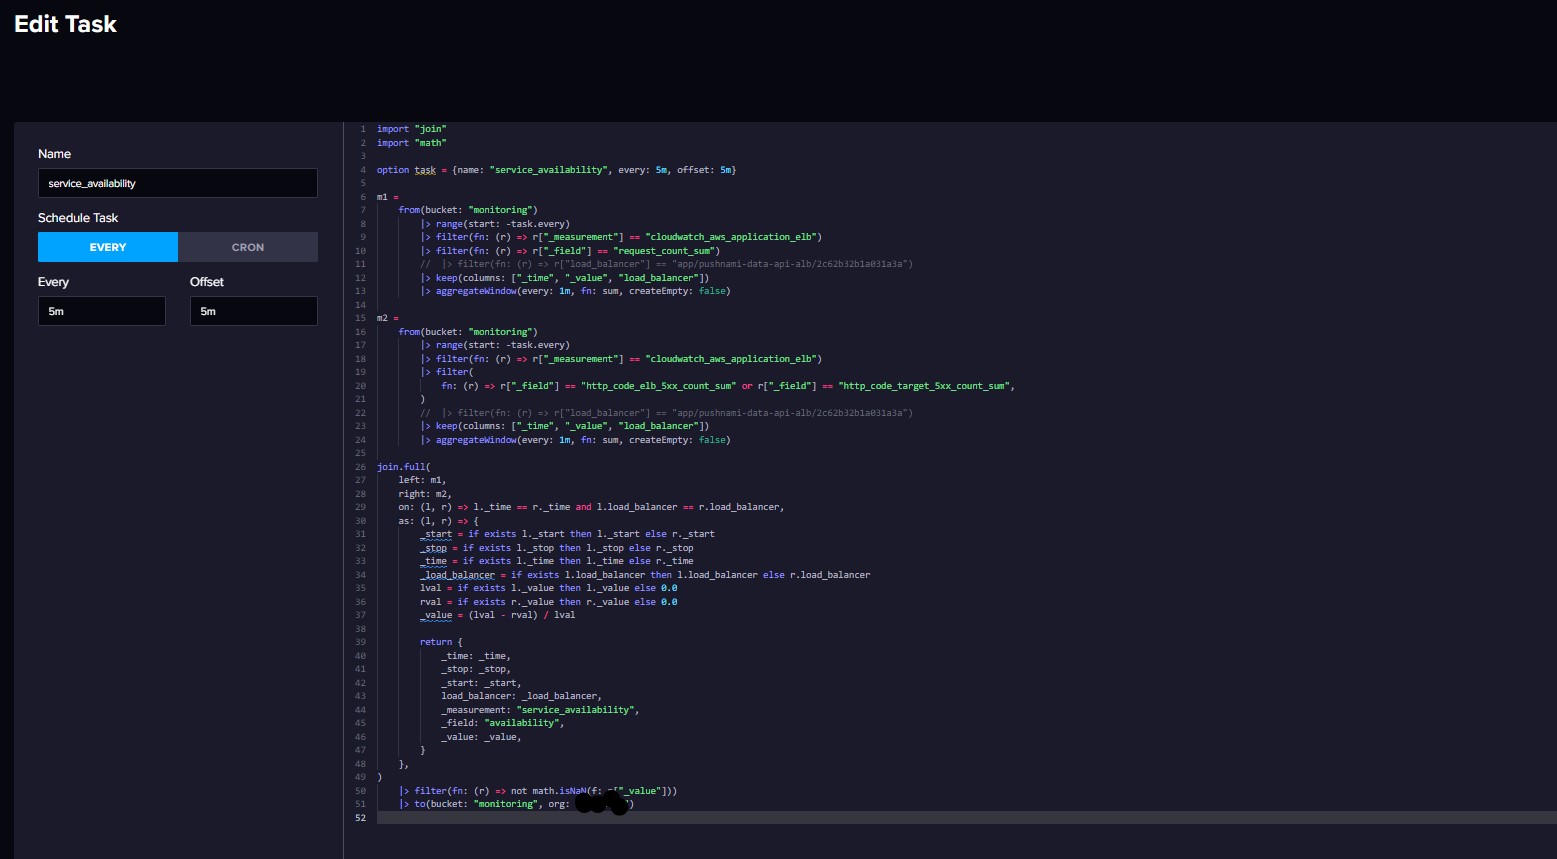
1. ...Create Task that performs full join on 2 measurements with 3 fields and maps to perform calculated data and maps to single calculated value represented in new measurement/field.
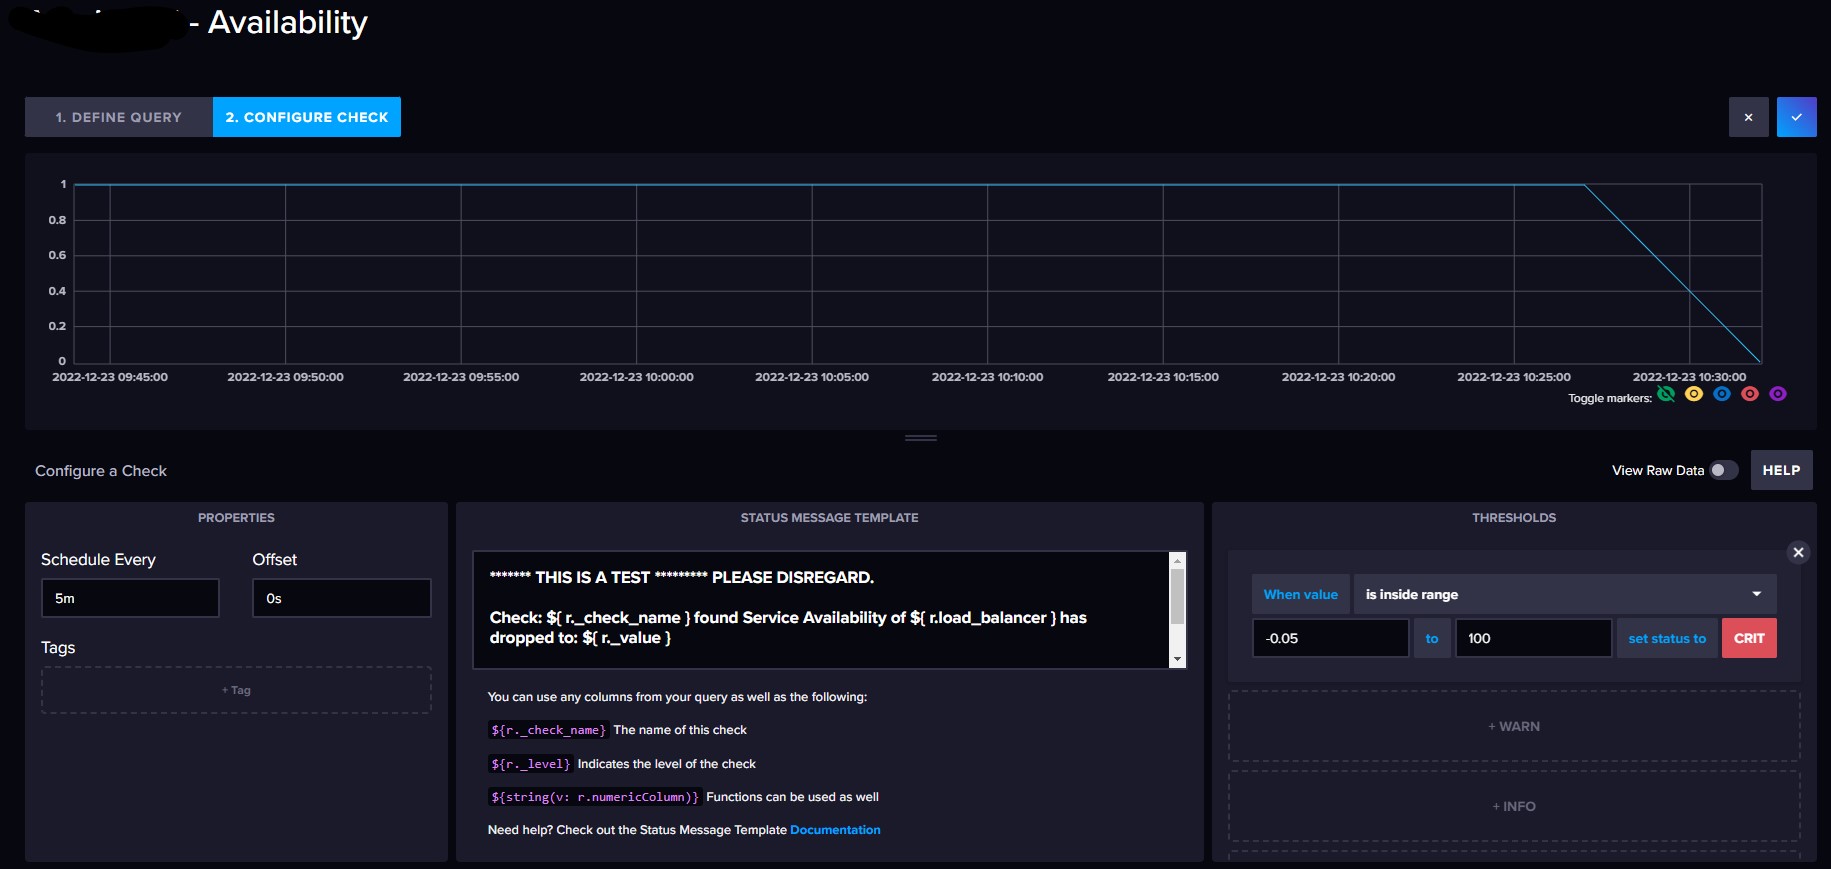
2. ...Create check to run every 5m with or without offsets on new measurement/field/(and load balancer in this case) with any condition that should trigger with given data.
3. ...Create Notification Rule that will send data to any of the notification endpoints based on conditions.
__Expected behavior:__
1. Expect to see the Check, trigger an alert.
2. Expect to see data populate in Alert History.
__Actual behavior:__
1. The check graph and raw data contain data from the task in real time and you can see the markers for the conditions graphically.
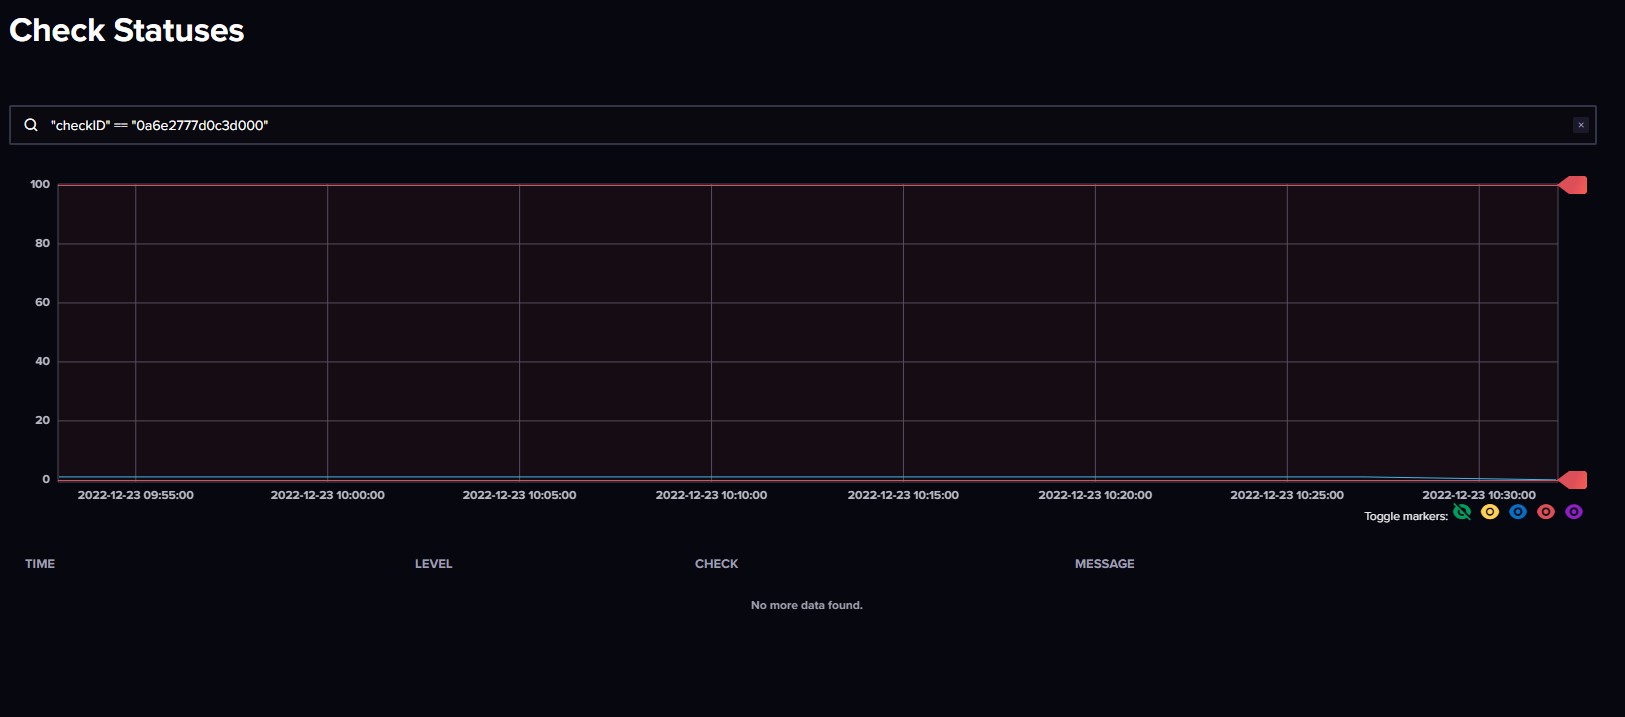
2. Within Check Statuses - Alert History: No more data found. Nothing is logged and no condition triggers are recorded.
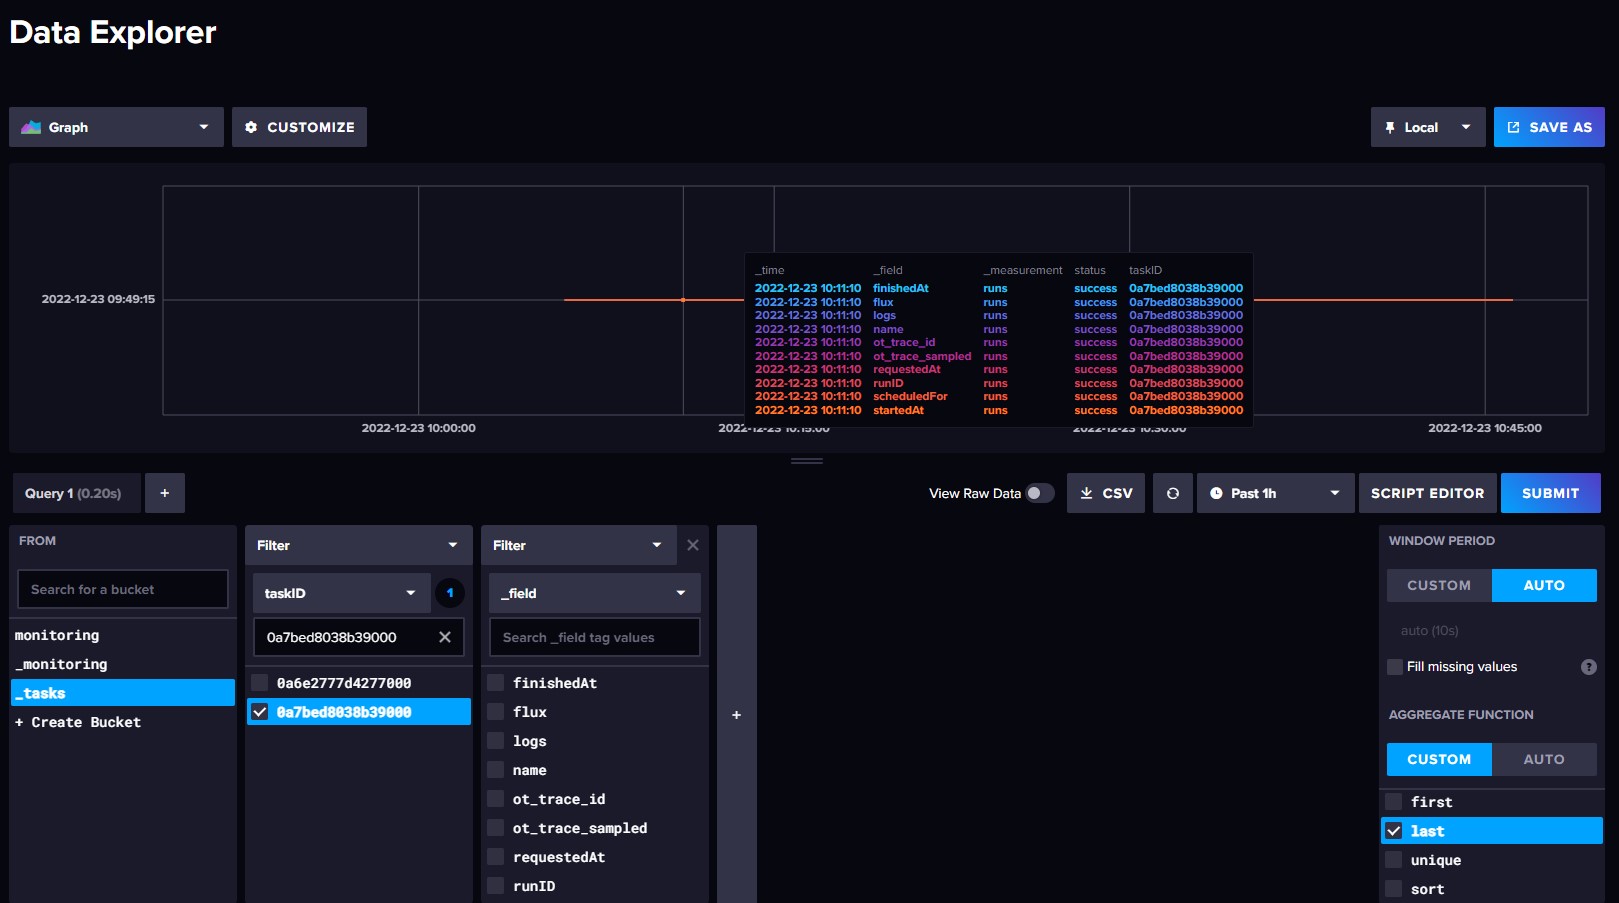
3. When looking at _tasks on specific task_ids within Data Explorer all fields show success and no failure/errors.
__Environment info:__
* System info: Run `uname -srm` and copy the output here : Linux 5.15.0-1026-aws x86_64
* InfluxDB version: Run `influxd version` and copy the output here: Influx CLI 2.6.0 (git: 90e825c) build_date: 2022-12-15T18:46:35Z
* Other relevant environment details: Container runtime, disk info, etc
* Filesystem Size Used Avail Use% Mounted on
/dev/root 49G 6.7G 42G 14% /
tmpfs 3.8G 0 3.8G 0% /dev/shm
tmpfs 1.5G 892K 1.5G 1% /run
tmpfs 5.0M 0 5.0M 0% /run/lock
/dev/nvme0n1p15 105M 5.3M 100M 5% /boot/efi
/dev/nvme1n1p1 98G 1.4G 92G 2% /data
tmpfs 766M 4.0K 766M 1% /run/user/1000
free -m
total used free shared buff/cache available
Mem: 7653 598 5096 0 1959 6793
Swap: 0 0 0
__Config:__
Copy any non-default config values here or attach the full config as a gist or file.
__Logs:__
Include snippet of errors in log.
__Performance:__
Generate profiles with the following commands for bugs related to performance, locking, out of memory (OOM), etc.
```sh
# Commands should be run when the bug is actively happening.
# Note: This command will run for ~30 seconds.
[iostat.txt](https://github.com/influxdata/influxdb/files/10296236/iostat.txt)
# Attach the `profiles.tar.gz` and `iostat.txt` output files.
```
[profiles.tar.gz](https://github.com/influxdata/influxdb/files/10296237/profiles.tar.gz)
Contributor guide
Research direction
Start by reproducing the reported sequence: a Task with a full join, a scheduled Check, and a Notification Rule. Compare the Check Statuses Alert History and condition markers with the task records shown in Data Explorer; done means triggered conditions and corresponding alert-history entries are recorded.
Written by the indexing model from the issue text.
Assessment
- Domain
- observability
- Issue type
- Bug
- Difficulty
- 4/5
- Estimated time
- 3-5 days
- Activity status
- Stale
- Clarity
- Needs clarification
- Newbie friendliness
- 25/100