influxdata / influxdata/influxdb
Spikes when using sum() grouped by time interval
- Dominant language
- Rust
- Stars
- 31.7k
- Forks
- 3.7k
- Avg merge
- 13h 37m
- Merged PRs (30d)
- 8
Description
Dear all,
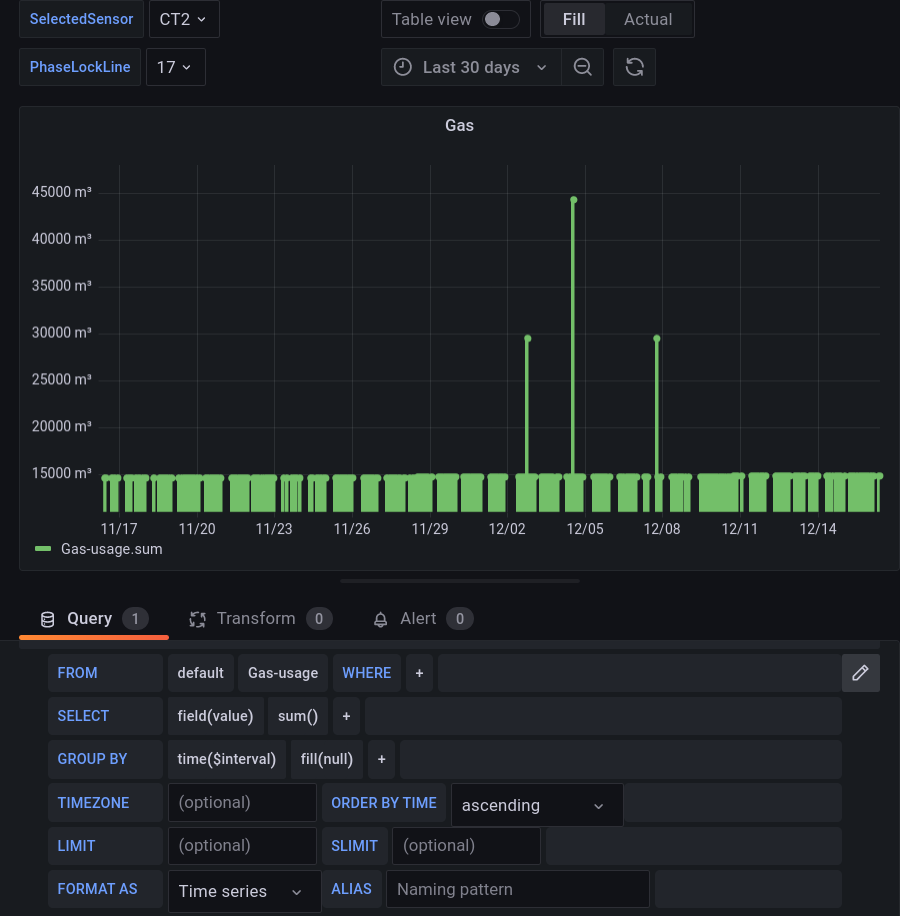
I see spikes when using sum() over time-span > 7d when grouped by time interval.
__Steps to reproduce:__
List the minimal actions needed to reproduce the behavior.
1. create a time series with hourly cumulative data (and some null's for missing data) for e.g. 30 days, e.g. using the data from my influxdb session over past 30 days.
`select * from "Gas-usage" where time>=now()-30d and time <=now() `
[influx-raw-30d.txt](https://github.com/influxdata/influxdb/files/10244042/influx-raw-30d.txt)
2. use the query like this using sum() grouped by time interval:
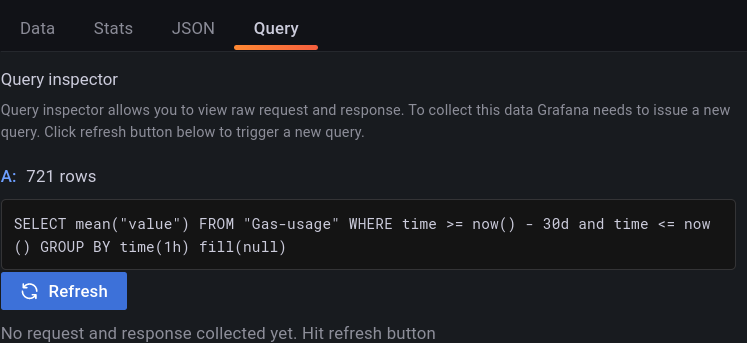
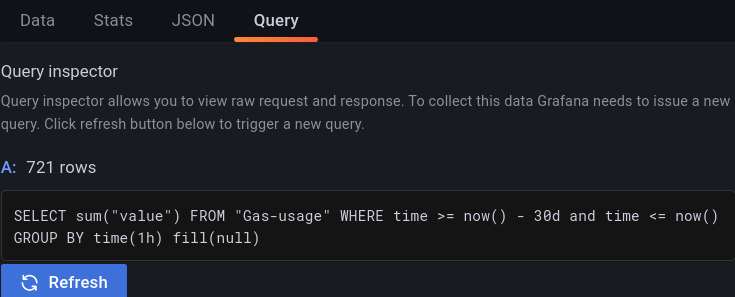
`SELECT sum("value") FROM "Gas-usage" WHERE time >= now() - 30d and time <= now() GROUP BY time(1h) fill(null)`
3. observe a number of spikes in the data
__Expected behavior:__
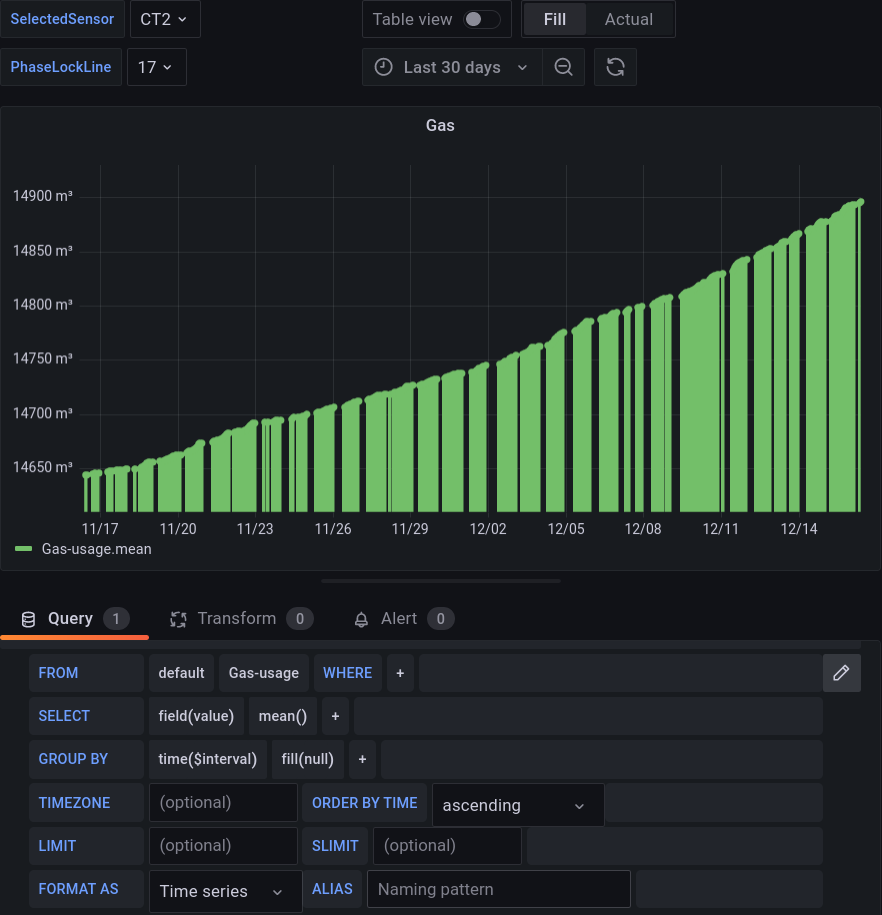
Here is the same query when using mean() instead of sum(), mean() should be similar when time interval is 1 hour:
__Actual behavior:__
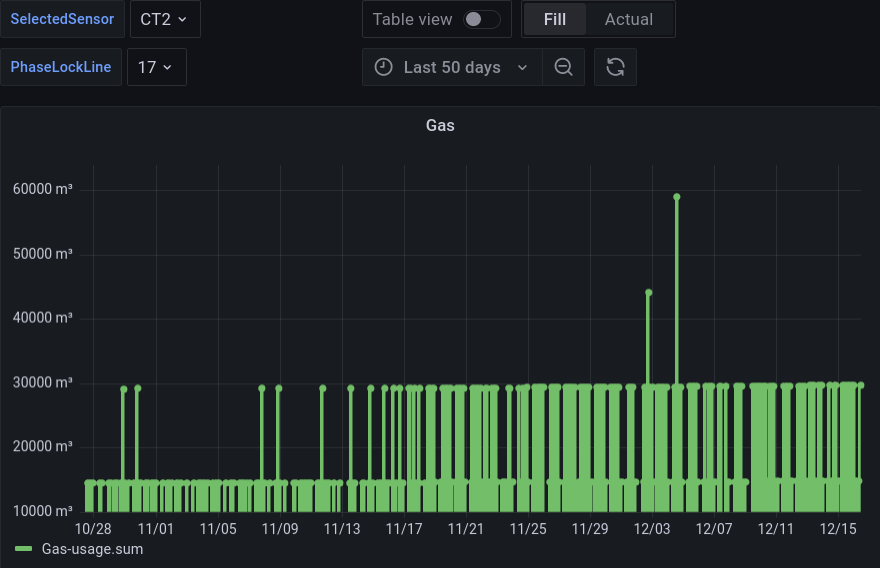
I see spikes in larger queries that use a sum() in (see also #7647). I use Grafana for display, but also get the same results when running the query directly in influxdb. Here are some graphs that show the spikes over cumulative gas usage (hourly measurements that are null when value didn't change) that is always increasing. The spikes seem to have a value that is multiple of the cumulative value. The issue seems to appear when the time-range is longer than 7 days (here 30 days):
A lot more spikes when time-span is larger (e.g. for 50 days):
__Environment info:__
influxdb 1.8.10 on ubuntu Linux
* System info: influxdb 1.8.10 on ubuntu Linux
* InfluxDB version: InfluxDB v1.8.10 (git: 1.8 688e697c51fd)
* Other relevant environment details: see also #7647 for similar issue back in 2016
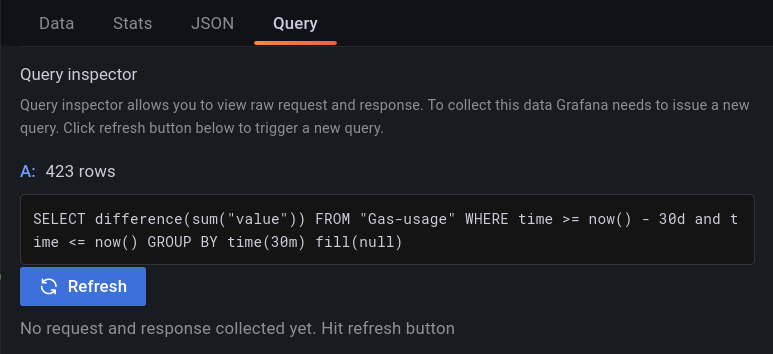
I want to use the sum since to show the gas usage per time interval at different time-zoom levels, with mean this works when time-interval is 1 hour, but not when it is larger (then I get an average instead of a sum).
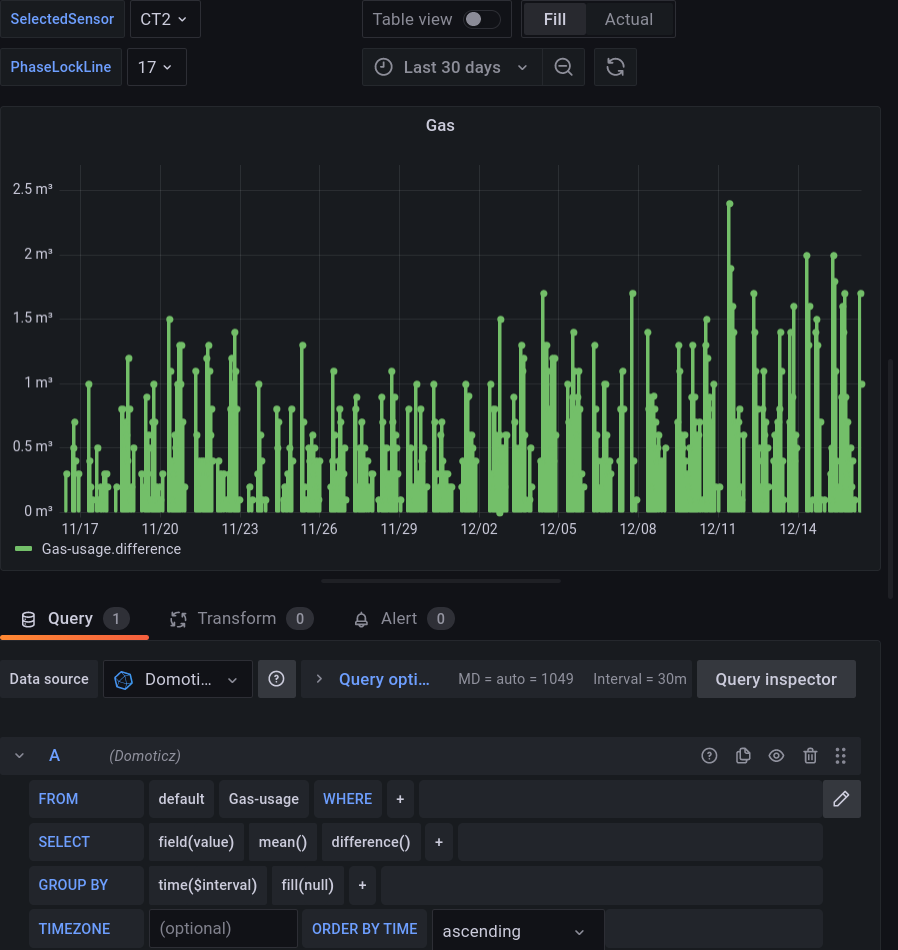
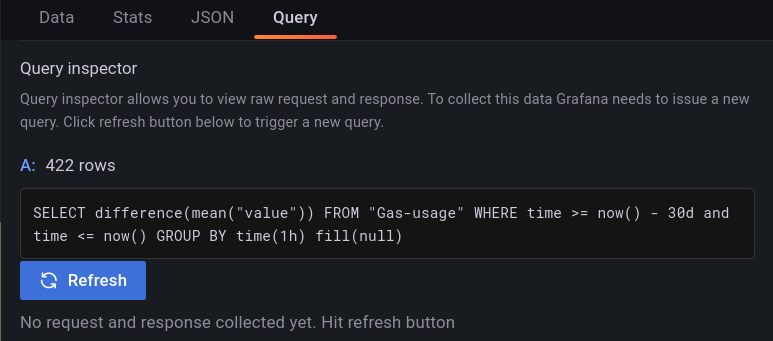
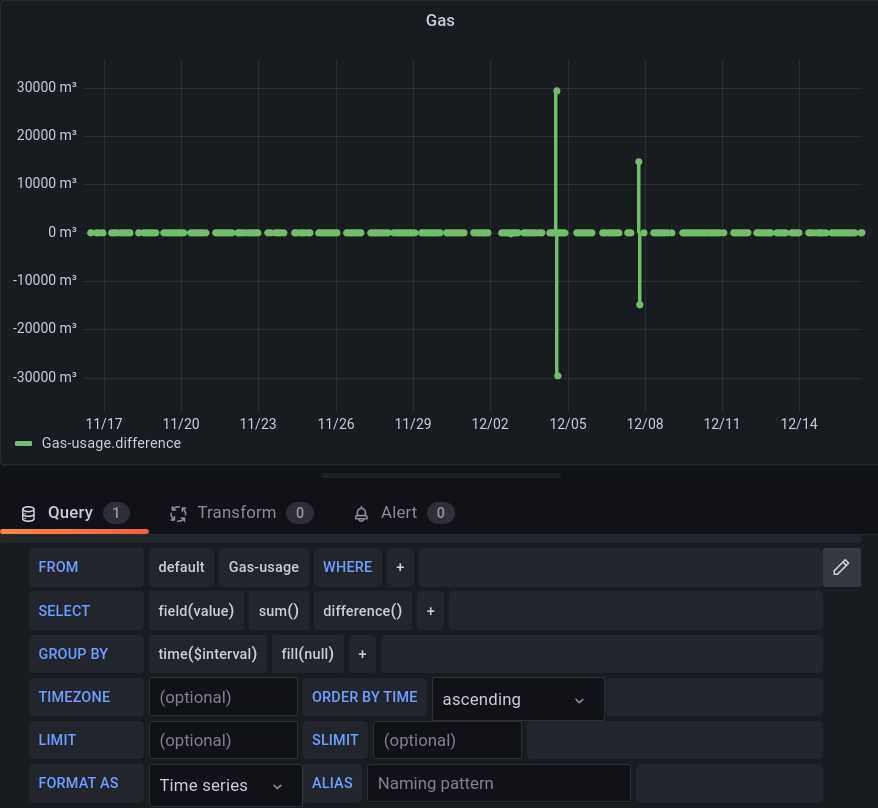
Here are CSV files for the data of the first two graphs using sum() and mean().
- [Gas-data-2022-12-16 09 28 50-using-mean.csv](https://github.com/influxdata/influxdb/files/10243972/Gas-data-2022-12-16.09.28.50-using-mean.csv)
- [Gas-data-2022-12-16 09 28 21-using-sum.csv](https://github.com/influxdata/influxdb/files/10243974/Gas-data-2022-12-16.09.28.21-using-sum.csv)
__Config:__
Copy any non-default config values here or attach the full config as a gist or file.
__Logs:__
Include snippet of errors in log.
__Performance:__
Generate profiles with the following commands for bugs related to performance, locking, out of memory (OOM), etc.
```sh
# Commands should be run when the bug is actively happening.
# Note: This command will run for ~30 seconds.
curl -o profiles.tar.gz "http://localhost:8086/debug/pprof/all?cpu=30s"
iostat -xd 1 30 > iostat.txt
# Attach the `profiles.tar.gz` and `iostat.txt` output files.
```
Kind regards,
Dennis
Contributor guide
Research direction
Start by reproducing the reported SELECT sum query on InfluxDB 1.8.10 with the attached hourly data, then compare its grouped output with mean() and the supplied CSV files. No source file or test is named; done would require identifying the cause of the long-range spikes and adding a regression test showing correct results for grouped sum queries.
Written by the indexing model from the issue text.
Assessment
- Domain
- databases
- Issue type
- Bug
- Difficulty
- 4/5
- Estimated time
- 3-5 days
- Activity status
- Stale
- Clarity
- Mostly clear
- Newbie friendliness
- 35/100