influxdata / influxdata/influxdb
Impossible to see columns in hover tooltip in Influx Dashboard
- Dominant language
- Rust
- Stars
- 31.7k
- Forks
- 3.7k
- Avg merge
- 13h 37m
- Merged PRs (30d)
- 8
Description
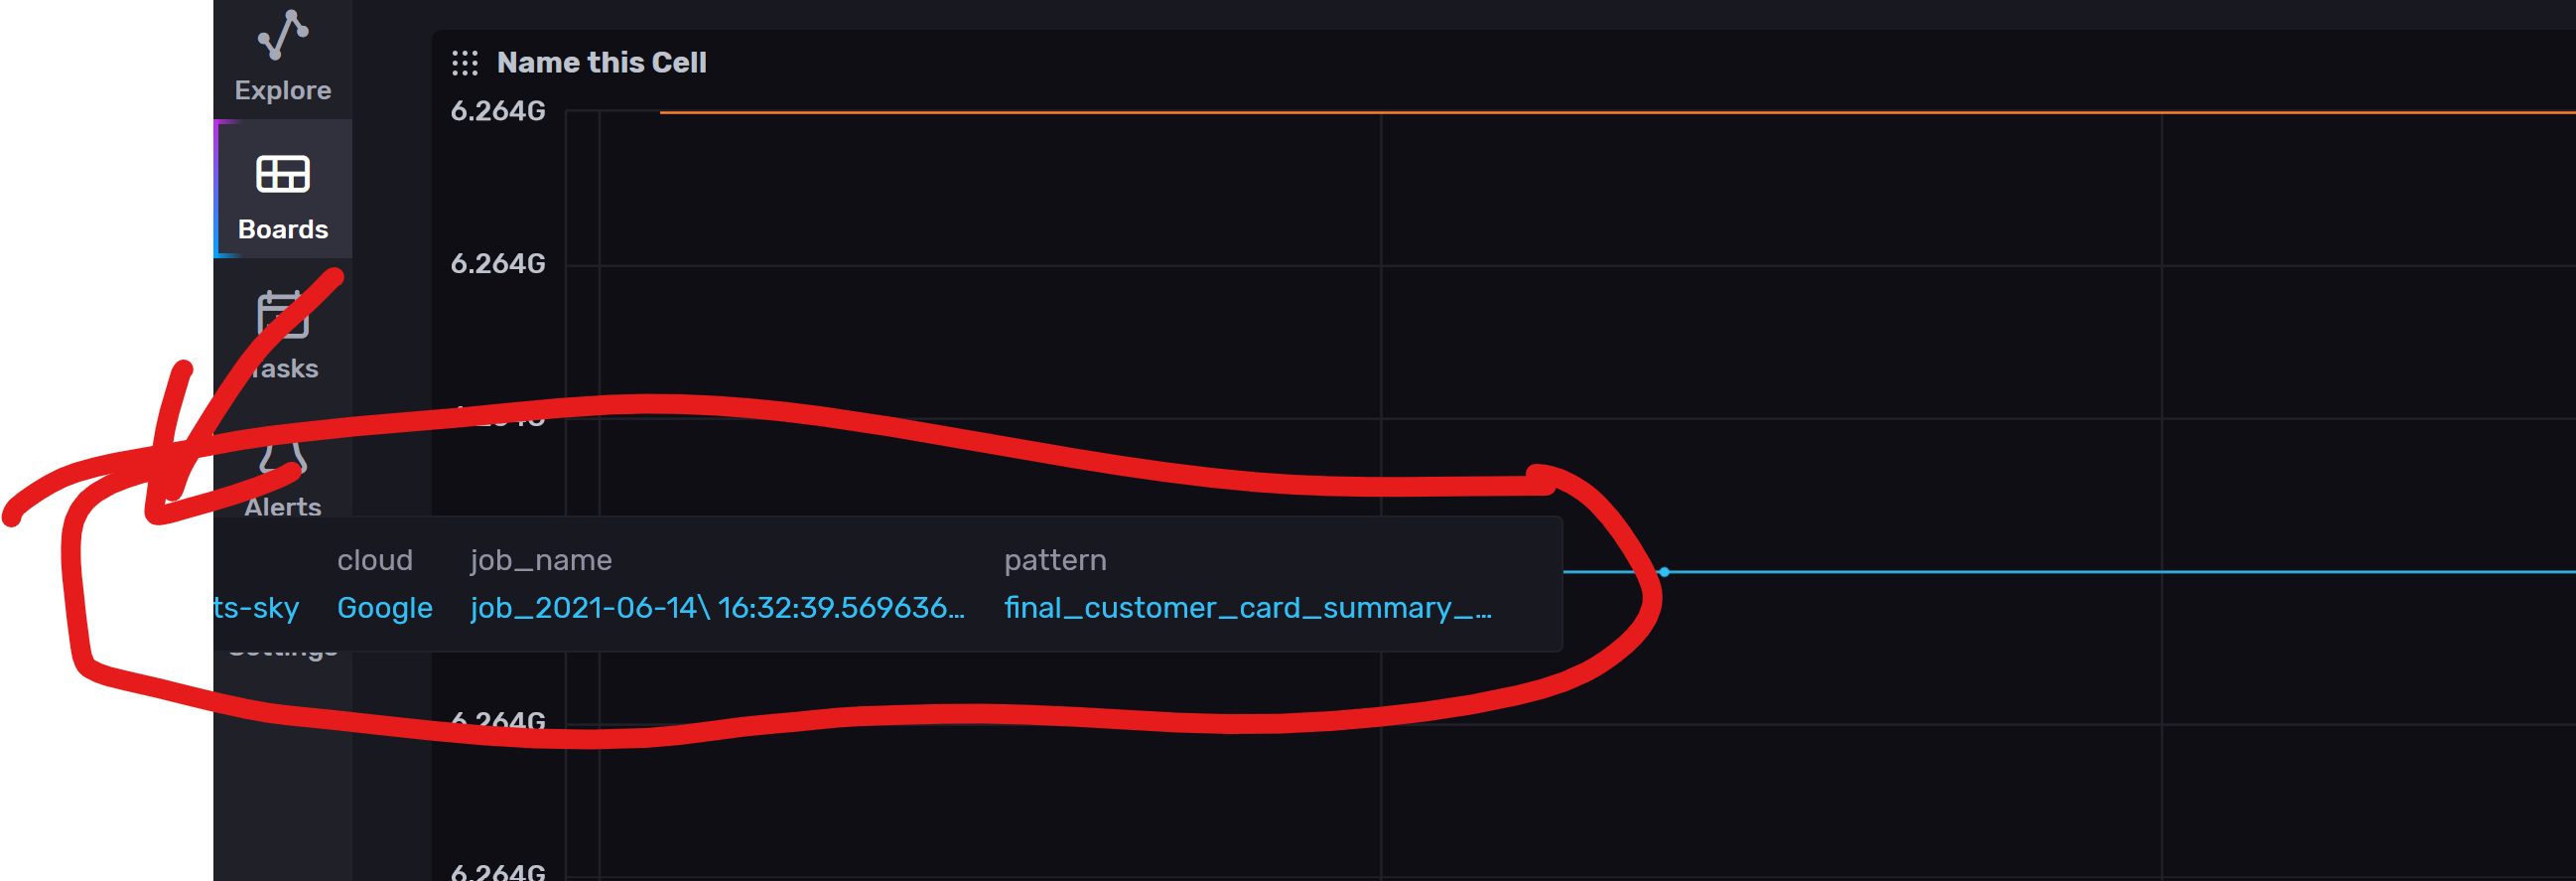
__Steps to reproduce:__
1. Create a measurement with 10 tags
2. Create a cell with that graph
3. Hover over a point on the graph
__Expected behavior:__
The tooltip collapses or moves to fit all values in the screen
__Actual behavior:__
The tooltip i placed wrong and the values are off the screen making it impossible to see them
__Environment info:__
Version 2.0.4 (4e7a59b)
Contributor guide
Research direction
Reproduce the issue in an Influx Dashboard cell using a measurement with 10 tags, then hover over a graph point to inspect the tooltip placement. Done means the tooltip collapses or moves within the screen so all values remain visible.
Written by the indexing model from the issue text.
Assessment
- Tech stack
- react
- Domain
- frontend
- Issue type
- Bug
- Difficulty
- 3/5
- Estimated time
- 1-2 days
- Activity status
- Stale
- Clarity
- Mostly clear
- Newbie friendliness
- 38/100