influxdata / influxdata/influxdb
Data Explorer groups some points that it shoud'nt
- Dominant language
- Rust
- Stars
- 31.7k
- Forks
- 3.7k
- Avg merge
- 13h 37m
- Merged PRs (30d)
- 8
Description
__Steps to reproduce:__
List the minimal actions needed to reproduce the behavior.
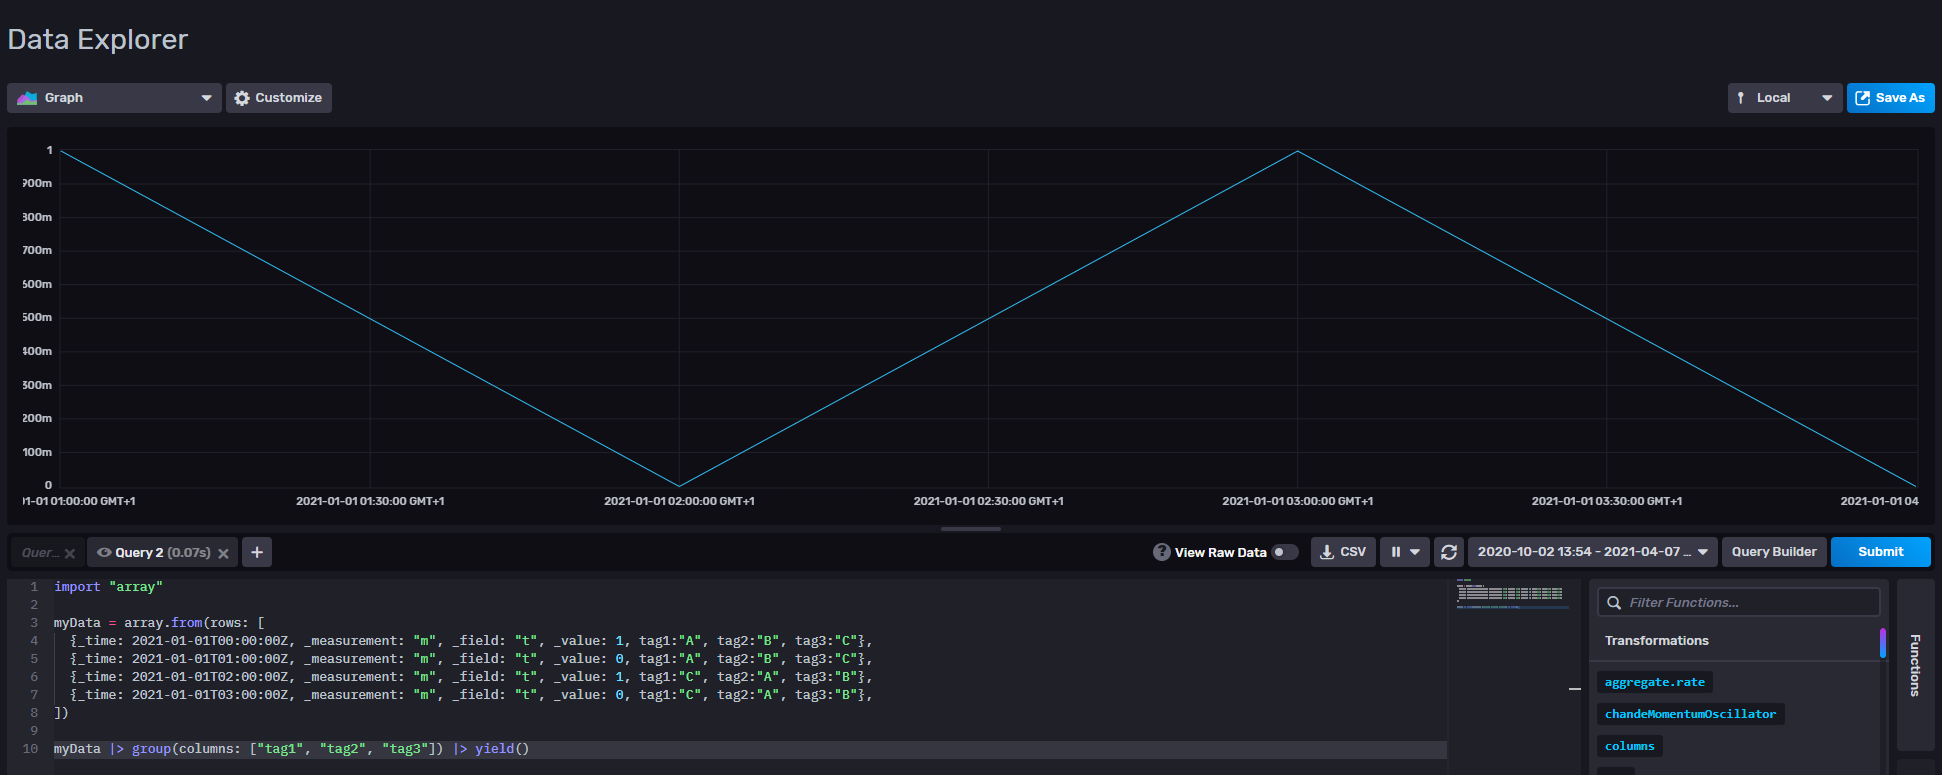
Run the following flux script:
```
import "array"
myData = array.from(rows: [
{_time: 2021-01-01T00:00:00Z, _measurement: "m", _field: "t", _value: 1, tag1:"A", tag2:"B", tag3:"C"},
{_time: 2021-01-01T01:00:00Z, _measurement: "m", _field: "t", _value: 0, tag1:"A", tag2:"B", tag3:"C"},
{_time: 2021-01-01T02:00:00Z, _measurement: "m", _field: "t", _value: 1, tag1:"C", tag2:"A", tag3:"B"},
{_time: 2021-01-01T03:00:00Z, _measurement: "m", _field: "t", _value: 0, tag1:"C", tag2:"A", tag3:"B"},
])
myData |> group(columns: ["tag1", "tag2", "tag3"]) |> yield()
```
__Expected behavior:__
Should display 2 lines with different colors like this:
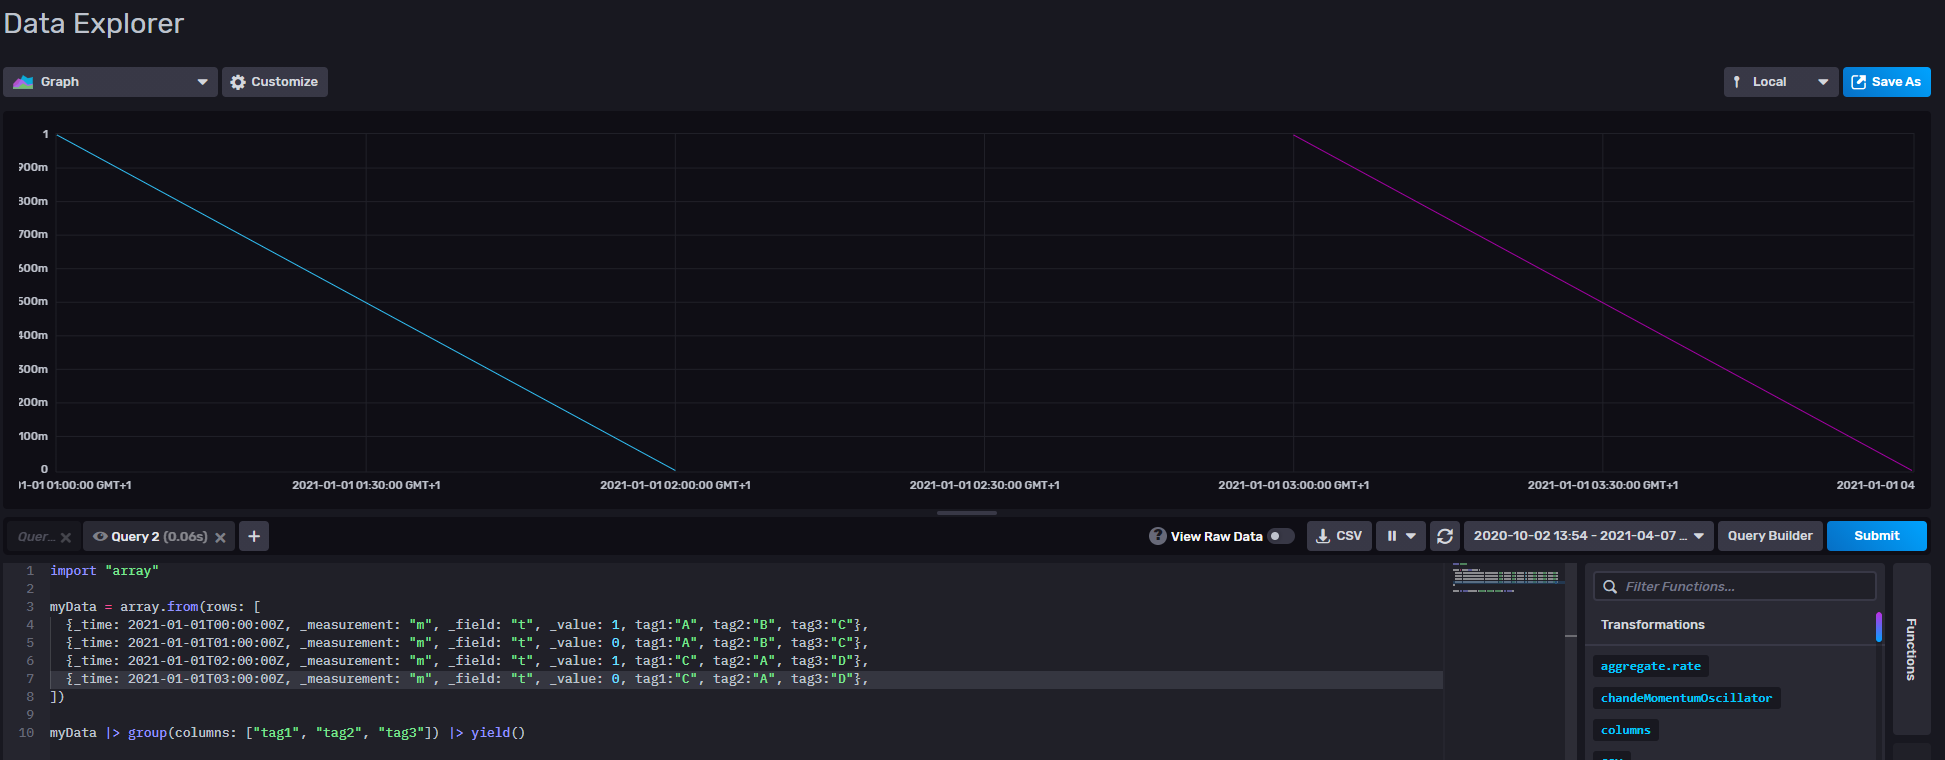
Rendered using this script:
```
import "array"
myData = array.from(rows: [
{_time: 2021-01-01T00:00:00Z, _measurement: "m", _field: "t", _value: 1, tag1:"A", tag2:"B", tag3:"C"},
{_time: 2021-01-01T01:00:00Z, _measurement: "m", _field: "t", _value: 0, tag1:"A", tag2:"B", tag3:"C"},
{_time: 2021-01-01T02:00:00Z, _measurement: "m", _field: "t", _value: 1, tag1:"C", tag2:"A", tag3:"D"},
{_time: 2021-01-01T03:00:00Z, _measurement: "m", _field: "t", _value: 0, tag1:"C", tag2:"A", tag3:"D"},
])
myData |> group(columns: ["tag1", "tag2", "tag3"]) |> yield()
```
It seems that only the values of tags are taken into account and not the tags themself
__Actual behavior:__
A third line joined point 2 and 3:
__Environment info:__
InfluxDB version: Version 2.0.4
Other relevant environment details: docker image quay.io/influxdb/influxdb:v2.0.4
Contributor guide
Research direction
Start by running the provided Flux script in the InfluxDB Data Explorer and compare the actual grouping with the expected two-line visualization. Trace how grouped tag data is converted into displayed series and verify the result with the reproduction case. Done means points from distinct tag groups are not joined into one line and the two groups receive distinct colors.
Written by the indexing model from the issue text.
Assessment
- Domain
- data-visualization
- Issue type
- Bug
- Difficulty
- 3/5
- Estimated time
- 1-2 days
- Activity status
- Stale
- Clarity
- Mostly clear
- Newbie friendliness
- 35/100