influxdata / influxdata/influxdb
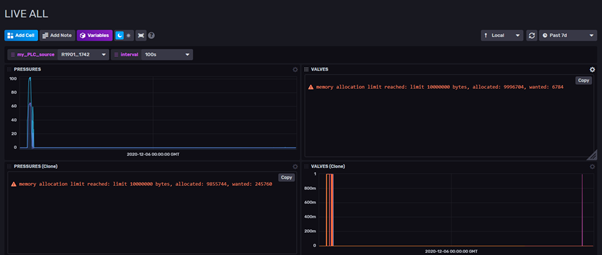
memory allocation limit reached: limit 10000000 bytes, allocated: xxxxxxxx, wanted: xxxxx
- Dominant language
- Rust
- Stars
- 31.7k
- Forks
- 3.7k
- Avg merge
- 13h 37m
- Merged PRs (30d)
- 8
Description
__Steps to reproduce:__
1. Happens on any dashboard that queries a lot of data with a simple query
e.g.
`from(bucket: "PLC_Router_Data")
|> range(start: v.timeRangeStart, stop: v.timeRangeStop)
|> filter(fn: (r) => r["_measurement"] == "data")
|> filter(fn: (r) => r["host"] == v.my_PLC_source)
|> filter(fn: (r) => r["_field"] =~ /ress/ and r["_field"] !~ /Application/)
|> group(columns: ["_field"], mode:"by")
|> toFloat()
|> sort(columns: ["_time"], desc: false)`
__Expected behavior:__
I expect that performing the same query on the same dataset for the same duration either results in:
1) The query *always fails* if we are genuinely doing something that consumes massive amounts of memory (it succeeds 50% of the time)
OR
2) The query *always* succeeds if it's not
__Actual behavior:__
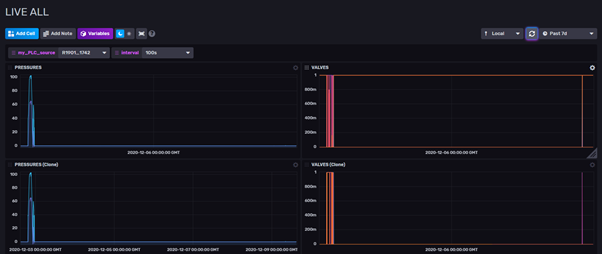
Sometimes you get data
Sometimes you get the failure
__Environment info:__
* InfluxDB 2.0 Cloud
Contributor guide
Assessment
This issue has not been assessed yet.