influxdata / influxdata/influxdb
[2.0.2 OSS] csv encoder error issue when retrieved from grafana (ok in influxdb dashboard)
- Dominant language
- Rust
- Stars
- 31.7k
- Forks
- 3.7k
- Avg merge
- 13h 37m
- Merged PRs (30d)
- 8
Description
__Steps to reproduce:__
Have this query in grafana:
```
from(bucket: "${bucket}")
|> range(start: v.timeRangeStart, stop: v.timeRangeStop)
|> filter(fn: (r) => r["_measurement"] == "net")
|> filter(fn: (r) => r["_field"] == "bytes_recv" or r["_field"] == "bytes_sent")
|> filter(fn: (r) => r["host"] == "${host}")
|> derivative(unit: v.windowPeriod, nonNegative: false)
|> yield(name: "derivative")
```
Works till last 6 hours - if i go up to last 12 hours, I see the "csv encoder error" issue.
It works in a InfluxDB 2.0 OSS Dashboard though.
```
from(bucket: v.bucket)
|> range(start: v.timeRangeStart, stop: v.timeRangeStop)
|> filter(fn: (r) => r["_measurement"] == "net")
|> filter(fn: (r) => r["_field"] == "bytes_recv" or r["_field"] == "bytes_sent")
|> filter(fn: (r) => r["host"] == v.host)
|> derivative(unit: v.windowPeriod, nonNegative: false)
|> yield(name: "derivative")
```
I noticed than when I wantted to group on _field (to avoid displaying stats per interfaces), it reports that the data are out of order - would it explain the issue ?
Such issue was mentionned in #13822 #13814
__Expected behavior:__
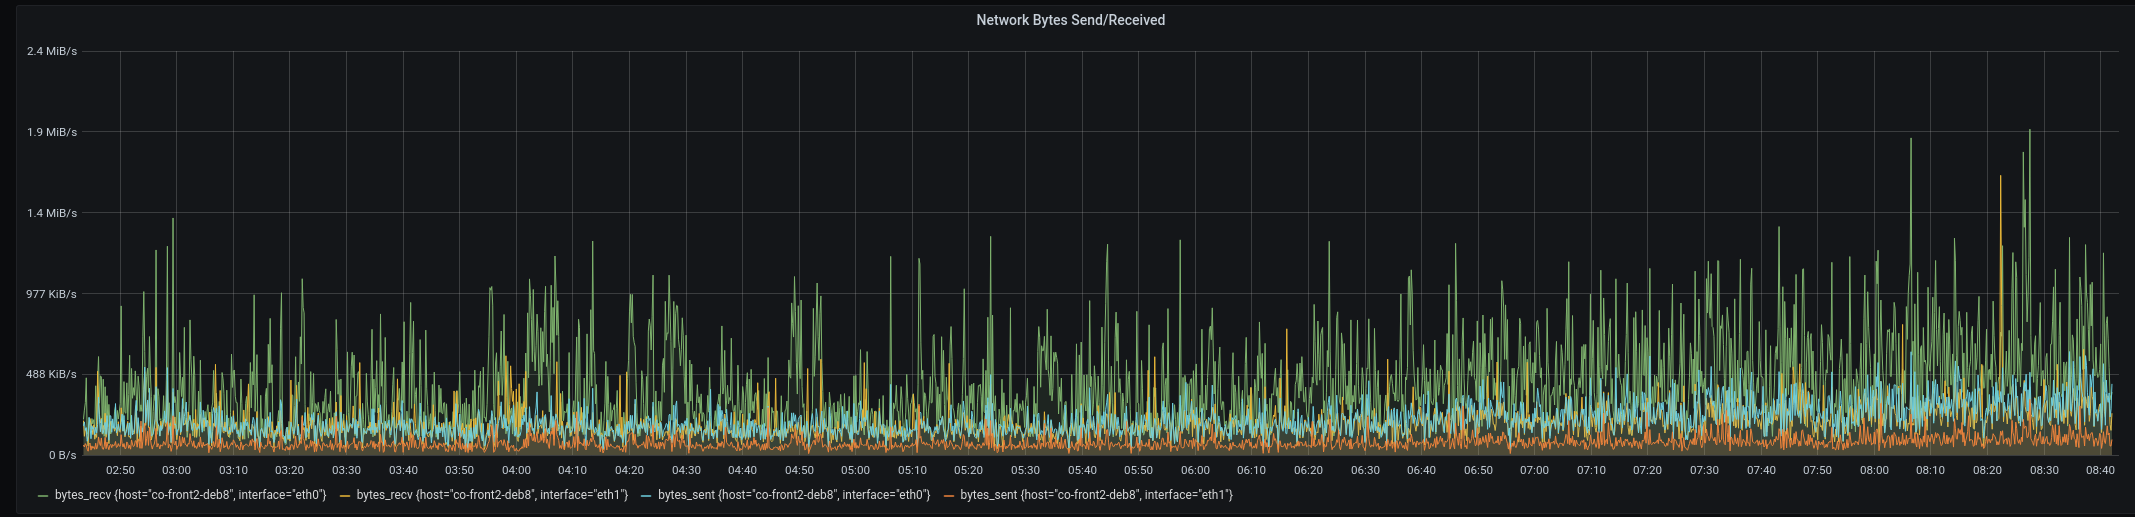
Points should be visible as for 6 hours or less
Last 6 hours:
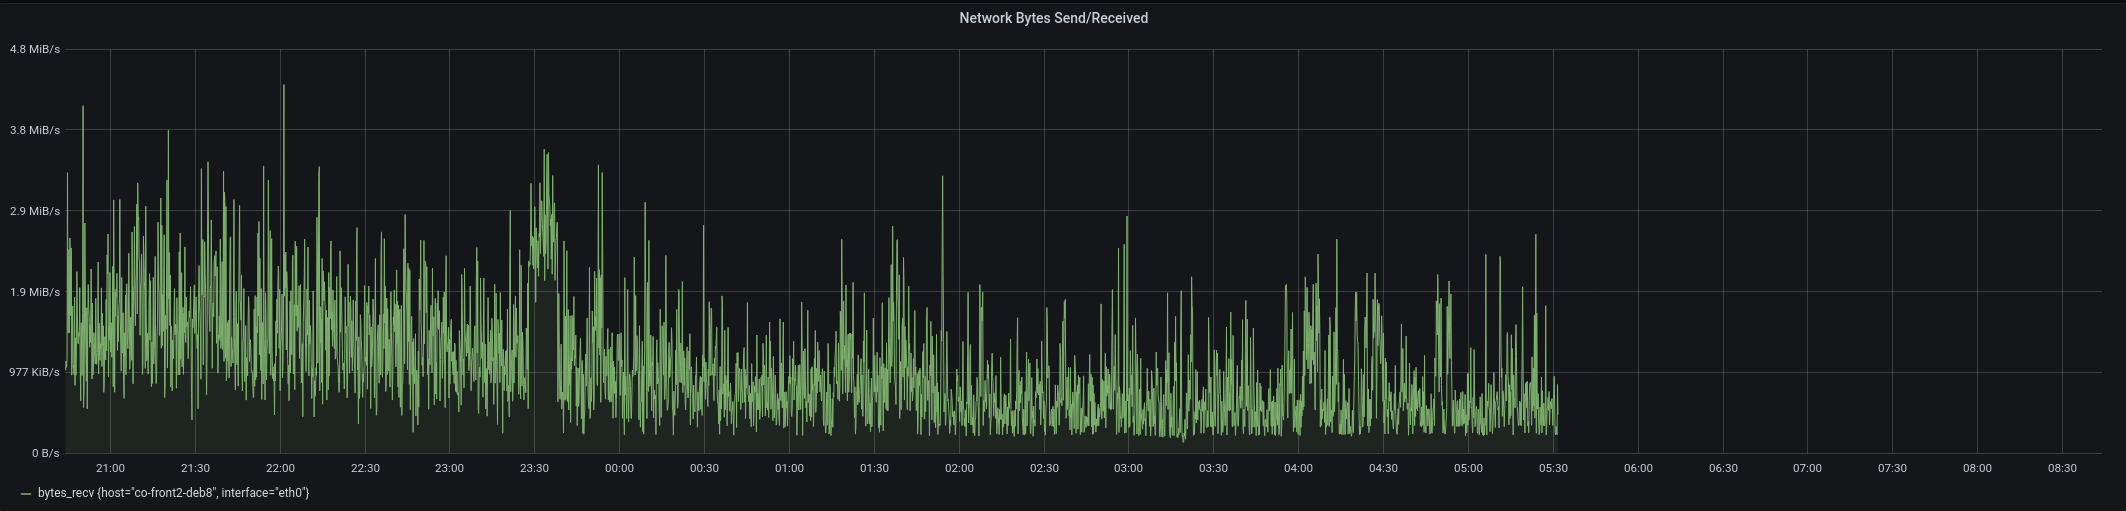
__Actual behavior:__
Last 12 hours or more - it's truncated and there is only one serie displayed
__Environment info:__
* InfluxDB version: InfluxDB 2.0.2 OSS - Grafana 7.3.3
* VM Debian 10.0 / 2 vCPU / 8 Go RAM
__Logs:__
```
Nov 24 08:38:44 crnt-d10-monitoring influxd[4578]: ts=2020-11-24T07:38:44.702783Z lvl=info msg="Error writing response to client" log_id=0Qav6bVG000 handler=flux error="csv encoder error: write tcp 127.0.0.1:8086->127.0.0.1:59186: write: broken pipe"
Nov 24 08:38:45 crnt-d10-monitoring influxd[4578]: ts=2020-11-24T07:38:45.177802Z lvl=info msg="Error writing response to client" log_id=0Qav6bVG000 handler=flux error="csv encoder error: write tcp 127.0.0.1:8086->127.0.0.1:59190: write: broken pipe"
```
Contributor guide
Research direction
No source file or test is identified in the report. Reproduce the Flux query through Grafana for six- and twelve-hour ranges, compare the returned series with the InfluxDB dashboard, and inspect the reported CSV encoder and broken-pipe logs. Done means the twelve-hour result is complete and displays all expected series without the encoder error.
Written by the indexing model from the issue text.
Assessment
- Domain
- databases
- Issue type
- Bug
- Difficulty
- 4/5
- Estimated time
- 3-5 days
- Activity status
- Stale
- Clarity
- Needs clarification
- Newbie friendliness
- 30/100