influxdata / influxdata/influxdb
Check graph in checks and notifications is not using "schedule every" interval
- Dominant language
- Rust
- Stars
- 31.7k
- Forks
- 3.7k
- Avg merge
- 13h 37m
- Merged PRs (30d)
- 8
Description
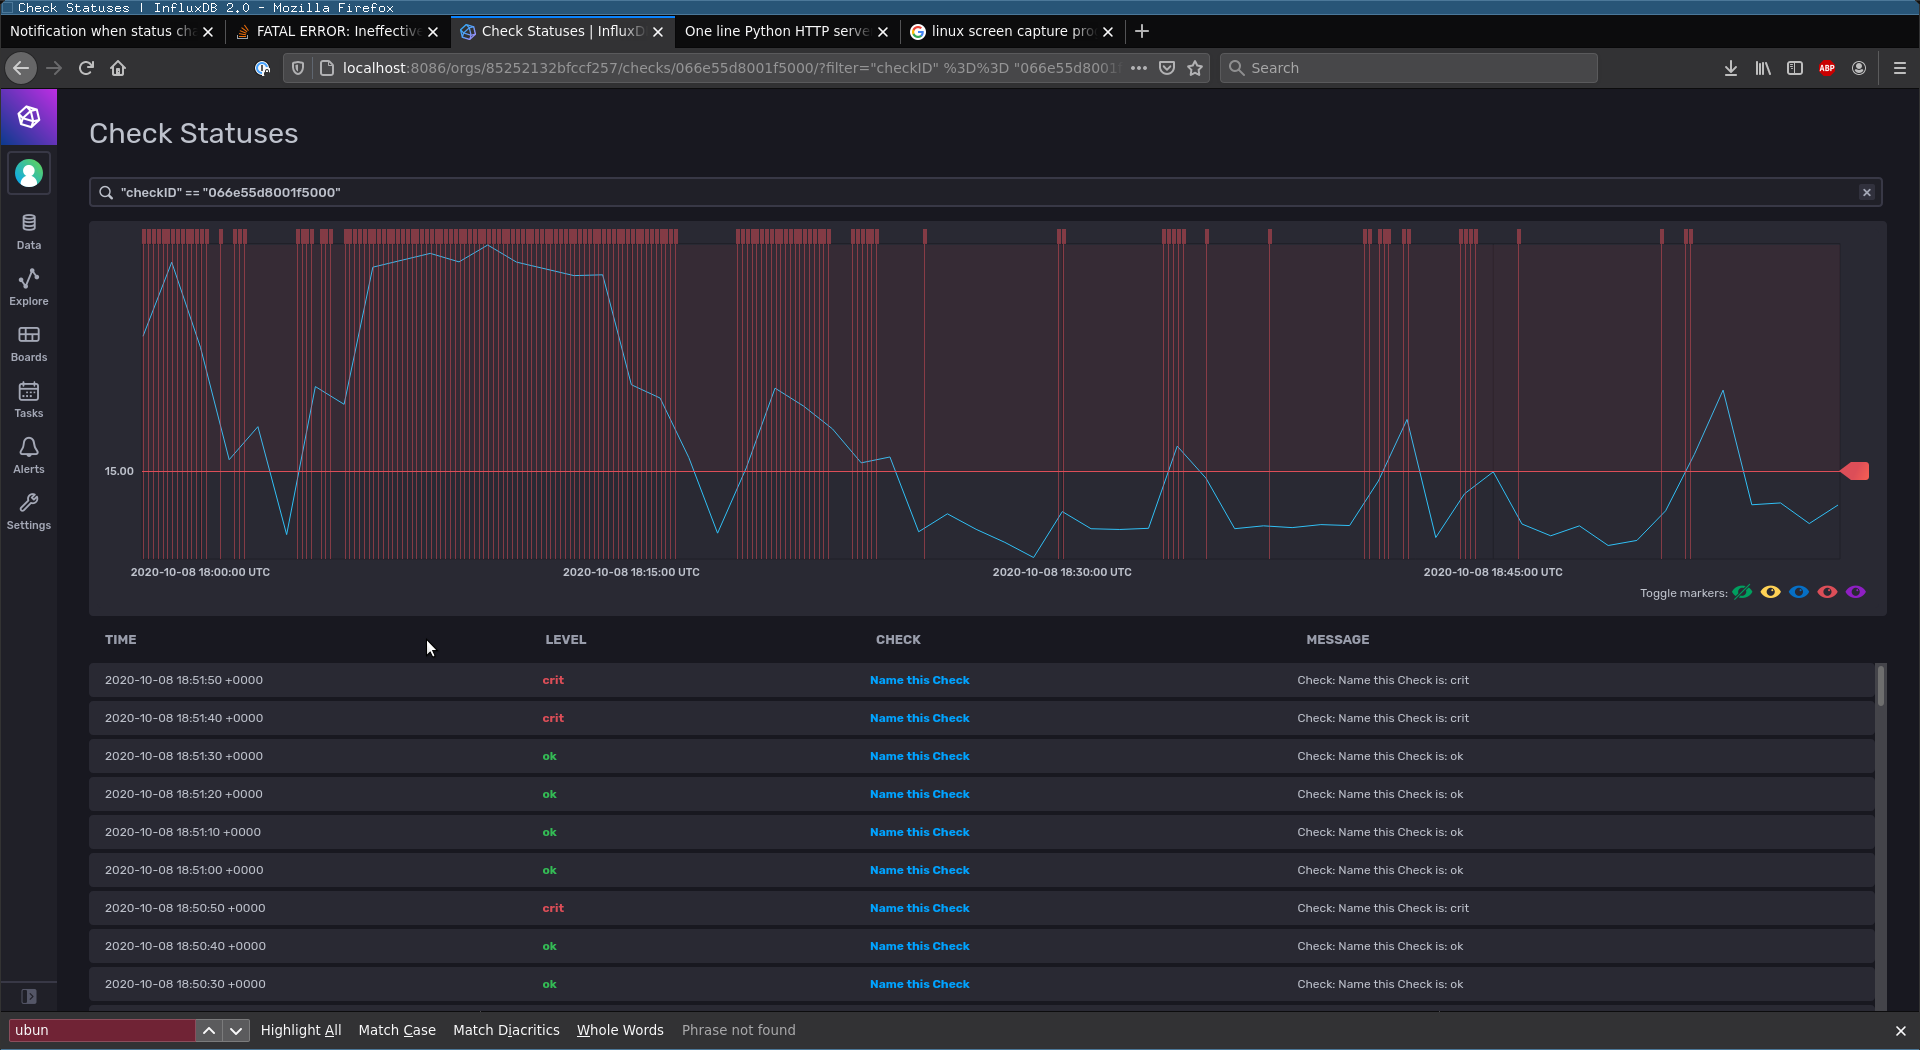
The check interval in this graph is set to 10s, but the graph is displaying intervals of 1m. This leads to some confusion as it can appear that the threshold is crossed when it shouldn't be.
__Steps to reproduce:__
List the minimal actions needed to reproduce the behavior.
1. Write some CPU data using telegraf.
2. Create a check with an interval of 10s.
3. Create a CRIT threshold that is easy to cross by a spinner `bash -c "while true; do echo > /dev/null; done"`
4. Cross the threshold back and forth every 10 seconds.
5. From the alerts page view the history of the alert
__Expected behavior:__
When data is above threshold, expect to see solid row of red bars every 10s.
When data is below threshold, expect to see no red bars.
__Actual behavior:__
During temporary drops (inside 10s) there can be a bar where there should not be a bar, and vice versa.
__Environment info:__
* System info: `Linux jasper 5.4.0-48-generic #52-Ubuntu SMP Thu Sep 10 10:58:49 UTC 2020 x86_64 x86_64 x86_64 GNU/LinuxRun `
* InfluxDB version: `8763bb1af9e31896aaf9caef7658e3b6d3ad05a0`
* Other relevant environment details: Container runtime, disk info, etc
Contributor guide
Research direction
Reproduce the issue by writing CPU data with Telegraf, creating a check with a 10s interval and a CRIT threshold, then viewing alert history from the alerts page. Done means the graph shows red bars every 10s while the value is above the threshold and no red bars while it is below it.
Written by the indexing model from the issue text.
Assessment
- Domain
- observability
- Issue type
- Bug
- Difficulty
- 4/5
- Estimated time
- 3-5 days
- Activity status
- Stale
- Clarity
- Mostly clear
- Newbie friendliness
- 35/100