influxdata / influxdata/influxdb
Unexpected memory consumption while using tsi
- Dominant language
- Rust
- Stars
- 31.7k
- Forks
- 3.7k
- Avg merge
- 13h 37m
- Merged PRs (30d)
- 8
Description
I'm suspecting some sort of a memory leak in tsi on v1.8.2.
I'm running the following query only by changing the conditions (for a 5y period):
`SELECT count("state") FROM "dbname"."autogen"."telemetry" WHERE time > :start: AND time < :end: AND "state"='on' AND locationCity='Berlin' GROUP BY time(1d) FILL(null)`
1. I run the query - it takes **3.5s** to **6s** on each run (it iterates through 295 shards)
2. I run the query by changing the condition, which returns a large quantity of data (locationCountry='Germany' for example) - it takes **120s** to **150s** and the memory consumption grows dramatically
3. I run the same query given in (1) - it now takes at least **40s** to run
When I've analyzed the queries, I've found out that the planning times are growing on the iterations of the 3rd run (durations are in ms):
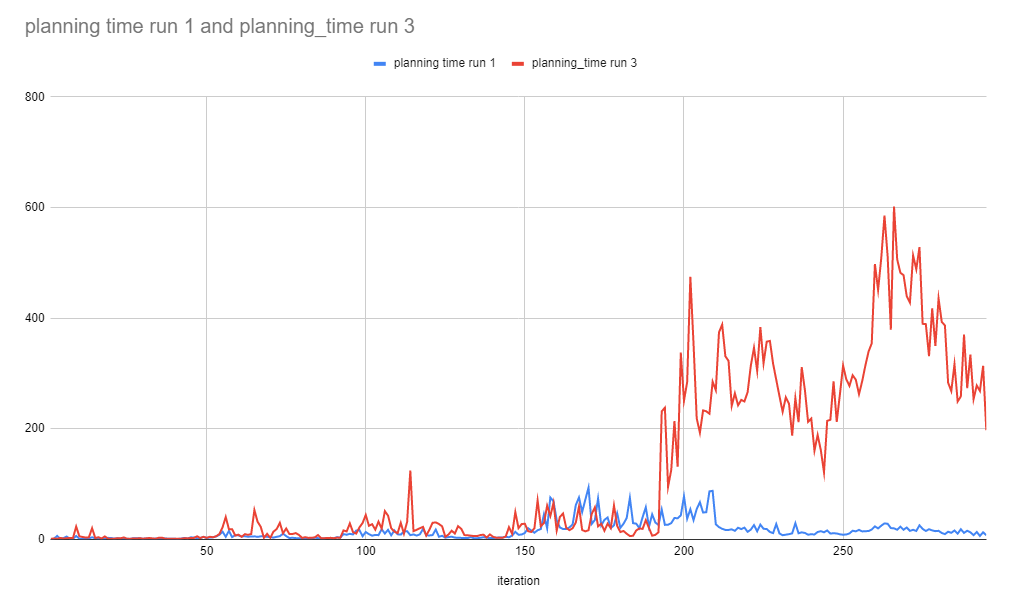
* `EXPLAIN ANALYZE` for (1): https://pastebin.pl/view/602112bb
* `EXPLAIN ANALYZE` for (3): https://pastebin.pl/view/154b3bba
So after run (2), run the same query given in (1) runs >10 times slower. It gets worse when I run the long-running query; it starts consuming all free memory and influxd crashes due to out of memory.
__Environment info:__
* System info: Linux 4.14.192-147.314.amzn2.x86_64 x86_64
* InfluxDB version: 1.8.2
* Other relevant environment details:
* wal and data resides on separate drives
* Read/write queue is always empty (so no IOPS delays)
Contributor guide
Research direction
Start by reproducing the reported tsi behavior on InfluxDB v1.8.2 with the two five-year queries and compare the linked EXPLAIN ANALYZE outputs for runs (1) and (3). Inspect planning and memory behavior across repeated queries, using the shard count and Linux environment as context. Done means the cause is identified and the regression or memory growth is covered by a repeatable test.
Written by the indexing model from the issue text.
Assessment
- Domain
- databases, performance
- Issue type
- Bug
- Difficulty
- 4/5
- Estimated time
- 3-5 days
- Activity status
- Stale
- Clarity
- Mostly clear
- Newbie friendliness
- 35/100