influxdata / influxdata/influxdb
[UI] Hovering over chart should tell you value and time
- Dominant language
- Rust
- Stars
- 31.7k
- Forks
- 3.7k
- Avg merge
- 13h 37m
- Merged PRs (30d)
- 8
Description
__Proposal:__
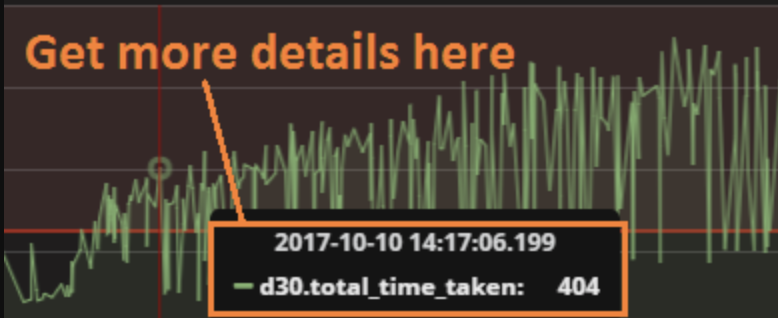
Many small charts can be difficult to read individual points and timestamps. Hovering _anywhere_ on the chart should show you the data point in that vertical column, its value, the timestamp it occurred at, and visualize it with a vertical bar.
__Use case:__
Difficult to read times on charts that are not full-page width, and difficult to get detail on exact values.
Contributor guide
Research direction
No files, tests, or entry points are named. Start by locating the small-chart UI component and its existing hover behavior, then confirm the implementation path with maintainers. Done means hovering anywhere on a chart shows the aligned data point, its value and timestamp, and a vertical bar.
Written by the indexing model from the issue text.
Assessment
- Tech stack
- react
- Domain
- data-visualization, frontend
- Issue type
- Feature
- Difficulty
- 4/5
- Estimated time
- 3-5 days
- Activity status
- Stale
- Clarity
- Mostly clear
- Newbie friendliness
- 35/100