influxdata / influxdata/influxdb
Dividing the two sensor values in Grafana
- Dominant language
- Rust
- Stars
- 31.7k
- Forks
- 3.7k
- Avg merge
- 13h 37m
- Merged PRs (30d)
- 8
Description
I am not able to write the productivity code: Production Time/ Total time
Productivity:
it is the ratio of the production time of a coil to the total time taken to produce one coil.
i.e = . Production Time . Production time + Non production time
According to my code:
To create a Dashboard for Productivity:
We have the Dashboard for production of coil, in discrete Dashboard form in which we have the False time(No production) and True Time (Production)
it is the ratio of the production time of a coil to the total time taken to produce one coil.
i.e = . True (Time) . False (time) + True (Time)
I tried to write the code for it (but showing false result):
SELECT
(F * 0.01) / 60
FROM
(SELECT COUNT("Lichtschranke am Hauptgetriebe (RSZ)") as F
FROM "longproducts_ziehen_coil_id"
WHERE $timeFilter
AND "Lichtschranke am Hauptgetriebe (RSZ)" = true / ("Lichtschranke am Hauptgetriebe (RSZ)" = false + "Lichtschranke am Hauptgetriebe (RSZ)" = true))
GROUP BY
"coil_id".
Here are my two different queries which I want to divide
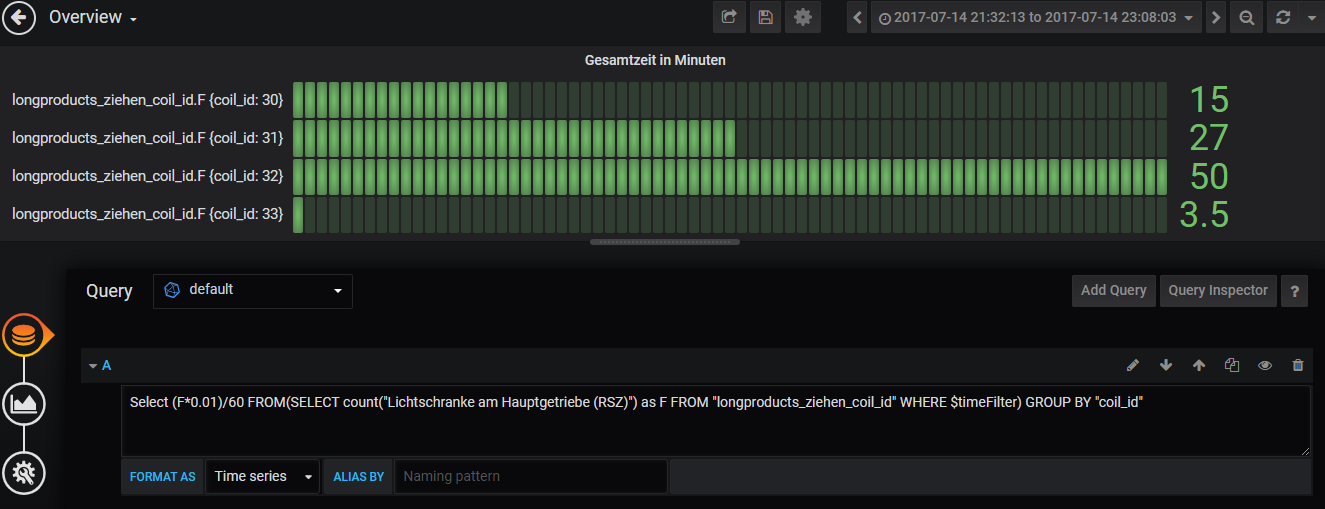
The code for the Total time to produce a coil(each coil is having unique id):
SELECT
(F * 0.01) / 60
FROM
(SELECT COUNT("Lichtschranke am Hauptgetriebe (RSZ)") as F
FROM "longproducts_ziehen_coil_id"
WHERE $timeFilter)
GROUP BY
"coil_id"
enter image description here
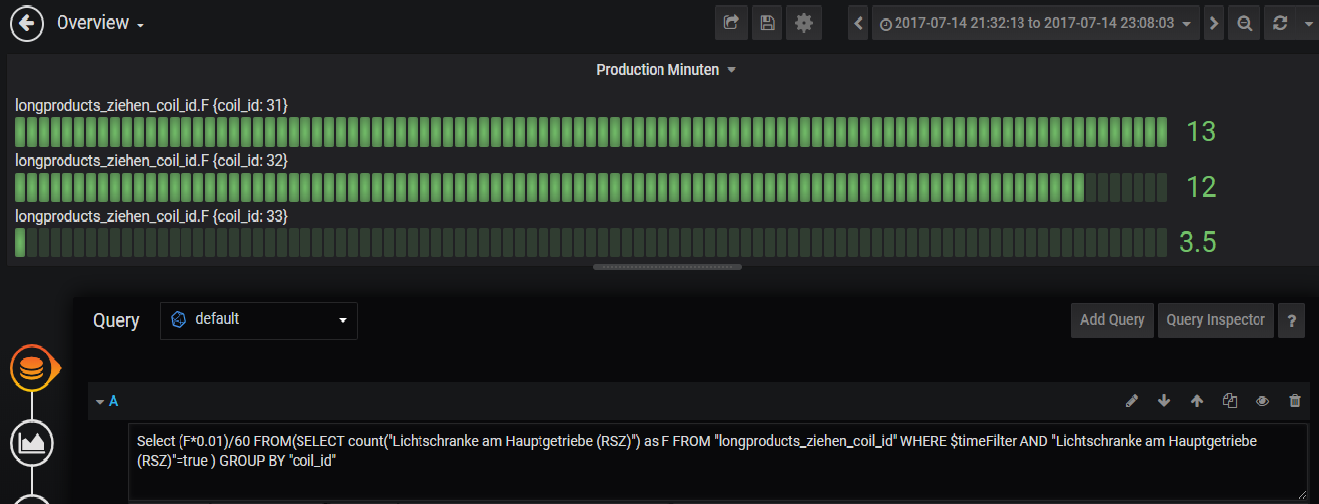
The code for the Production time to produce a coil (each coil is having unique id):
SELECT
(F * 0.01) / 60
FROM
(SELECT COUNT("Lichtschranke am Hauptgetriebe (RSZ)") as F
FROM "longproducts_ziehen_coil_id"
WHERE $timeFilter
AND "Lichtschranke am Hauptgetriebe (RSZ)" = true)
GROUP BY
"coil_id"
Contributor guide
Research direction
Start with the two SQL queries in the issue and compare their filtering and grouping by "coil_id". Check the Grafana query behavior for the true and total sensor values, then verify that the resulting ratio matches the stated productivity definition for each coil.
Written by the indexing model from the issue text.
Assessment
- Tech stack
- grafana, sql
- Domain
- data-visualization, databases
- Issue type
- Bug
- Difficulty
- 3/5
- Estimated time
- 1-2 days
- Activity status
- Stale
- Clarity
- Needs clarification
- Newbie friendliness
- 20/100