influxdata / influxdata/influxdb
Alternate Data Explorer view
Nobody has claimed this yet.
- Dominant language
- Rust
- Stars
- 31.7k
- Forks
- 3.7k
- Avg merge
- 13h 37m
- Merged PRs (30d)
- 8
Description
__Proposal:__
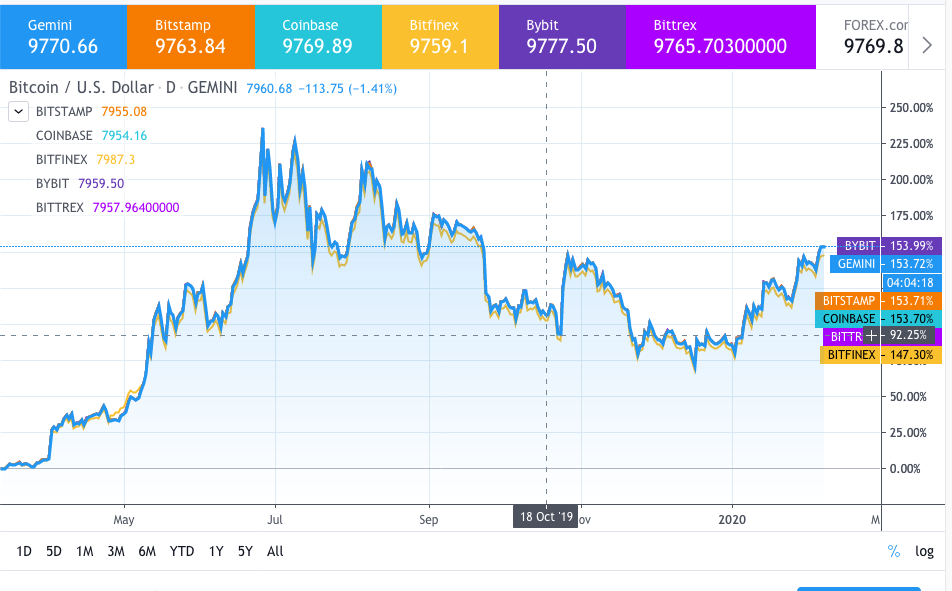
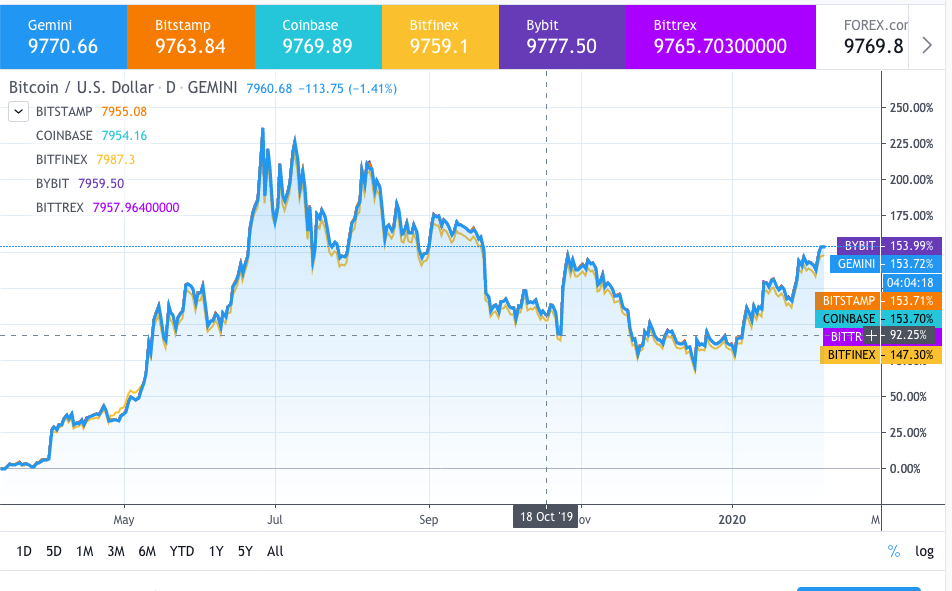
The above img is used as a reference point for the following description. This points to putting the data in the view for a legend. The ability to add inspection points of the query to the chart would be awesome. The top left of this chart can show current or closing(historical is almost always closing) price. This puts the data specifics in with the data without needing a tooltip.
Additionally, the ability to hover over a line and have it identified on the right in a bigger way would be incredibly handy for exploring the datasets I'm working with (financial data):
__Current behavior:__
tooltip data identifiers. In some circumstances (I suspect when > n lines, it shows only 1 line). Have to inspect the data with tool tip to get any data.
__Desired behavior:__
The solution
__Alternatives considered:__
Using www.tradingview.com instead of influxdb 🤷♂
__Use case:__
Working with financial data where by minute/5m/30m/etc updates are coming in regularly, and I just want a traffic light like view of it
here's the full featured explorer view from trading view: https://www.tradingview.com/chart/?symbol=GEMINI%3ABTCUSD
Contributor guide
First steps
- Read the whole issue, then the project's contributing guide.
- Comment on the issue to say you are picking it up — it saves two people doing the same work.
- Fork the repository and make your change on a branch.
- Open a pull request that references the issue number.
Research direction
The issue names no files or tests; start by locating the Data Explorer view and its chart or tooltip entry point. Before implementation, clarify acceptance criteria for the legend, inspection points, and hover identification, because the issue does not define what “done” means.
Written by the indexing model from the issue text.
Assessment
- Domain
- data-visualization, frontend
- Issue type
- Feature
- Difficulty
- 5/5
- Estimated time
- Over a week
- Activity status
- Stale
- Clarity
- Needs clarification
- Newbie friendliness
- 15/100