influxdata / influxdata/influxdb
Spike: Better View "Raw Data" in data explorer
- Dominant language
- Rust
- Stars
- 31.7k
- Forks
- 3.7k
- Avg merge
- 13h 37m
- Merged PRs (30d)
- 8
Description
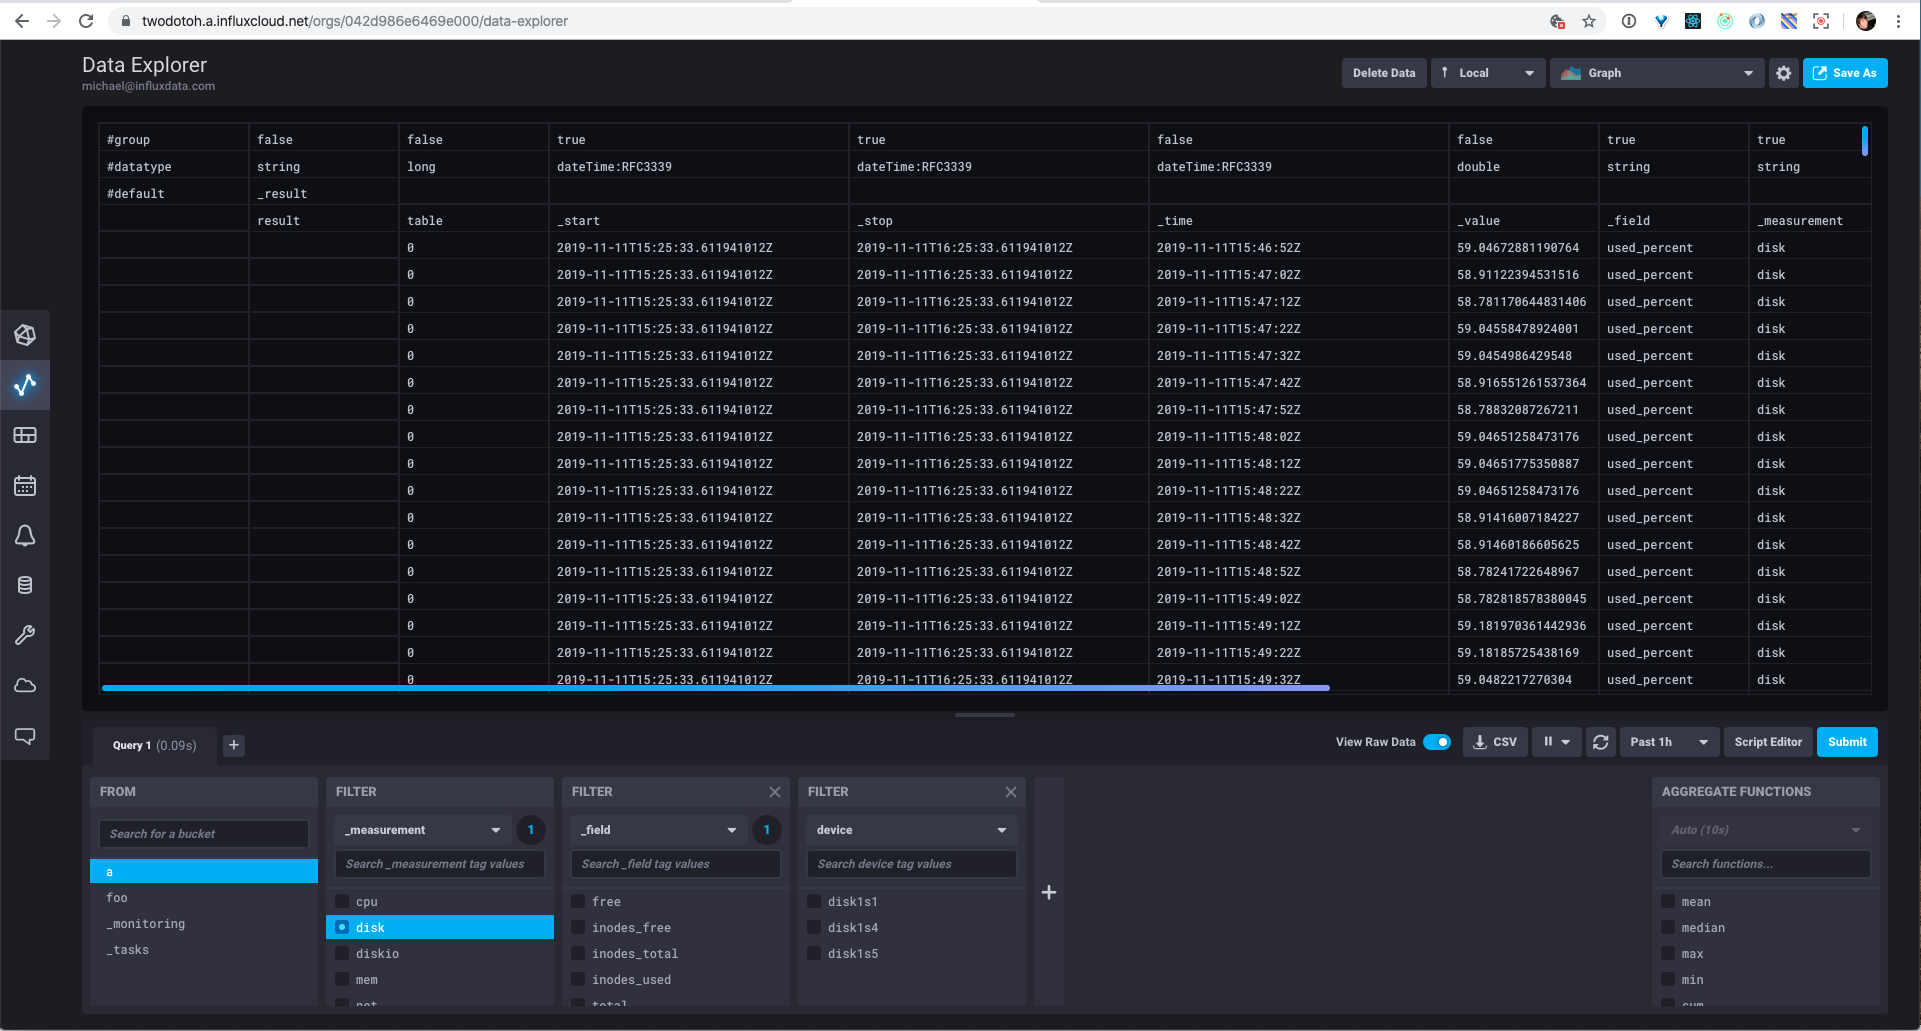
Currently, we display a tabular view of the CSV that is returned from a flux query. This can be particularly useful for debugging since it contains a detailed explanation of the data.
Specifically, it communicates
* which columns are in the group key
* the names of the columns returned
* the types of the columns returns
* the tables that are returned
The issue is that while it is nice to have a raw view of the data, it can be difficult to interpret the results. In particular determining which values are in the group key.
* table visually represented
* columns in the group key visually represented
* collapsable columns
* type information available on hover
Contributor guide
Research direction
Start in the data explorer's current tabular view of CSV returned from a Flux query. Determine how group keys, returned columns, column types, and tables are presented, then define a clearer visual treatment for tables, group-key columns, collapsible columns, and type information on hover. Done means the raw-data view is easier to interpret and covers the listed interactions.
Written by the indexing model from the issue text.
Assessment
- Tech stack
- react
- Domain
- frontend
- Issue type
- Feature
- Difficulty
- 5/5
- Estimated time
- Over a week
- Activity status
- Stale
- Clarity
- Needs clarification
- Newbie friendliness
- 25/100