influxdata / influxdata/influxdb
Align time on a dashboard
Nobody has claimed this yet.
- Dominant language
- Rust
- Stars
- 31.7k
- Forks
- 3.7k
- Avg merge
- 13h 37m
- Merged PRs (30d)
- 8
Description
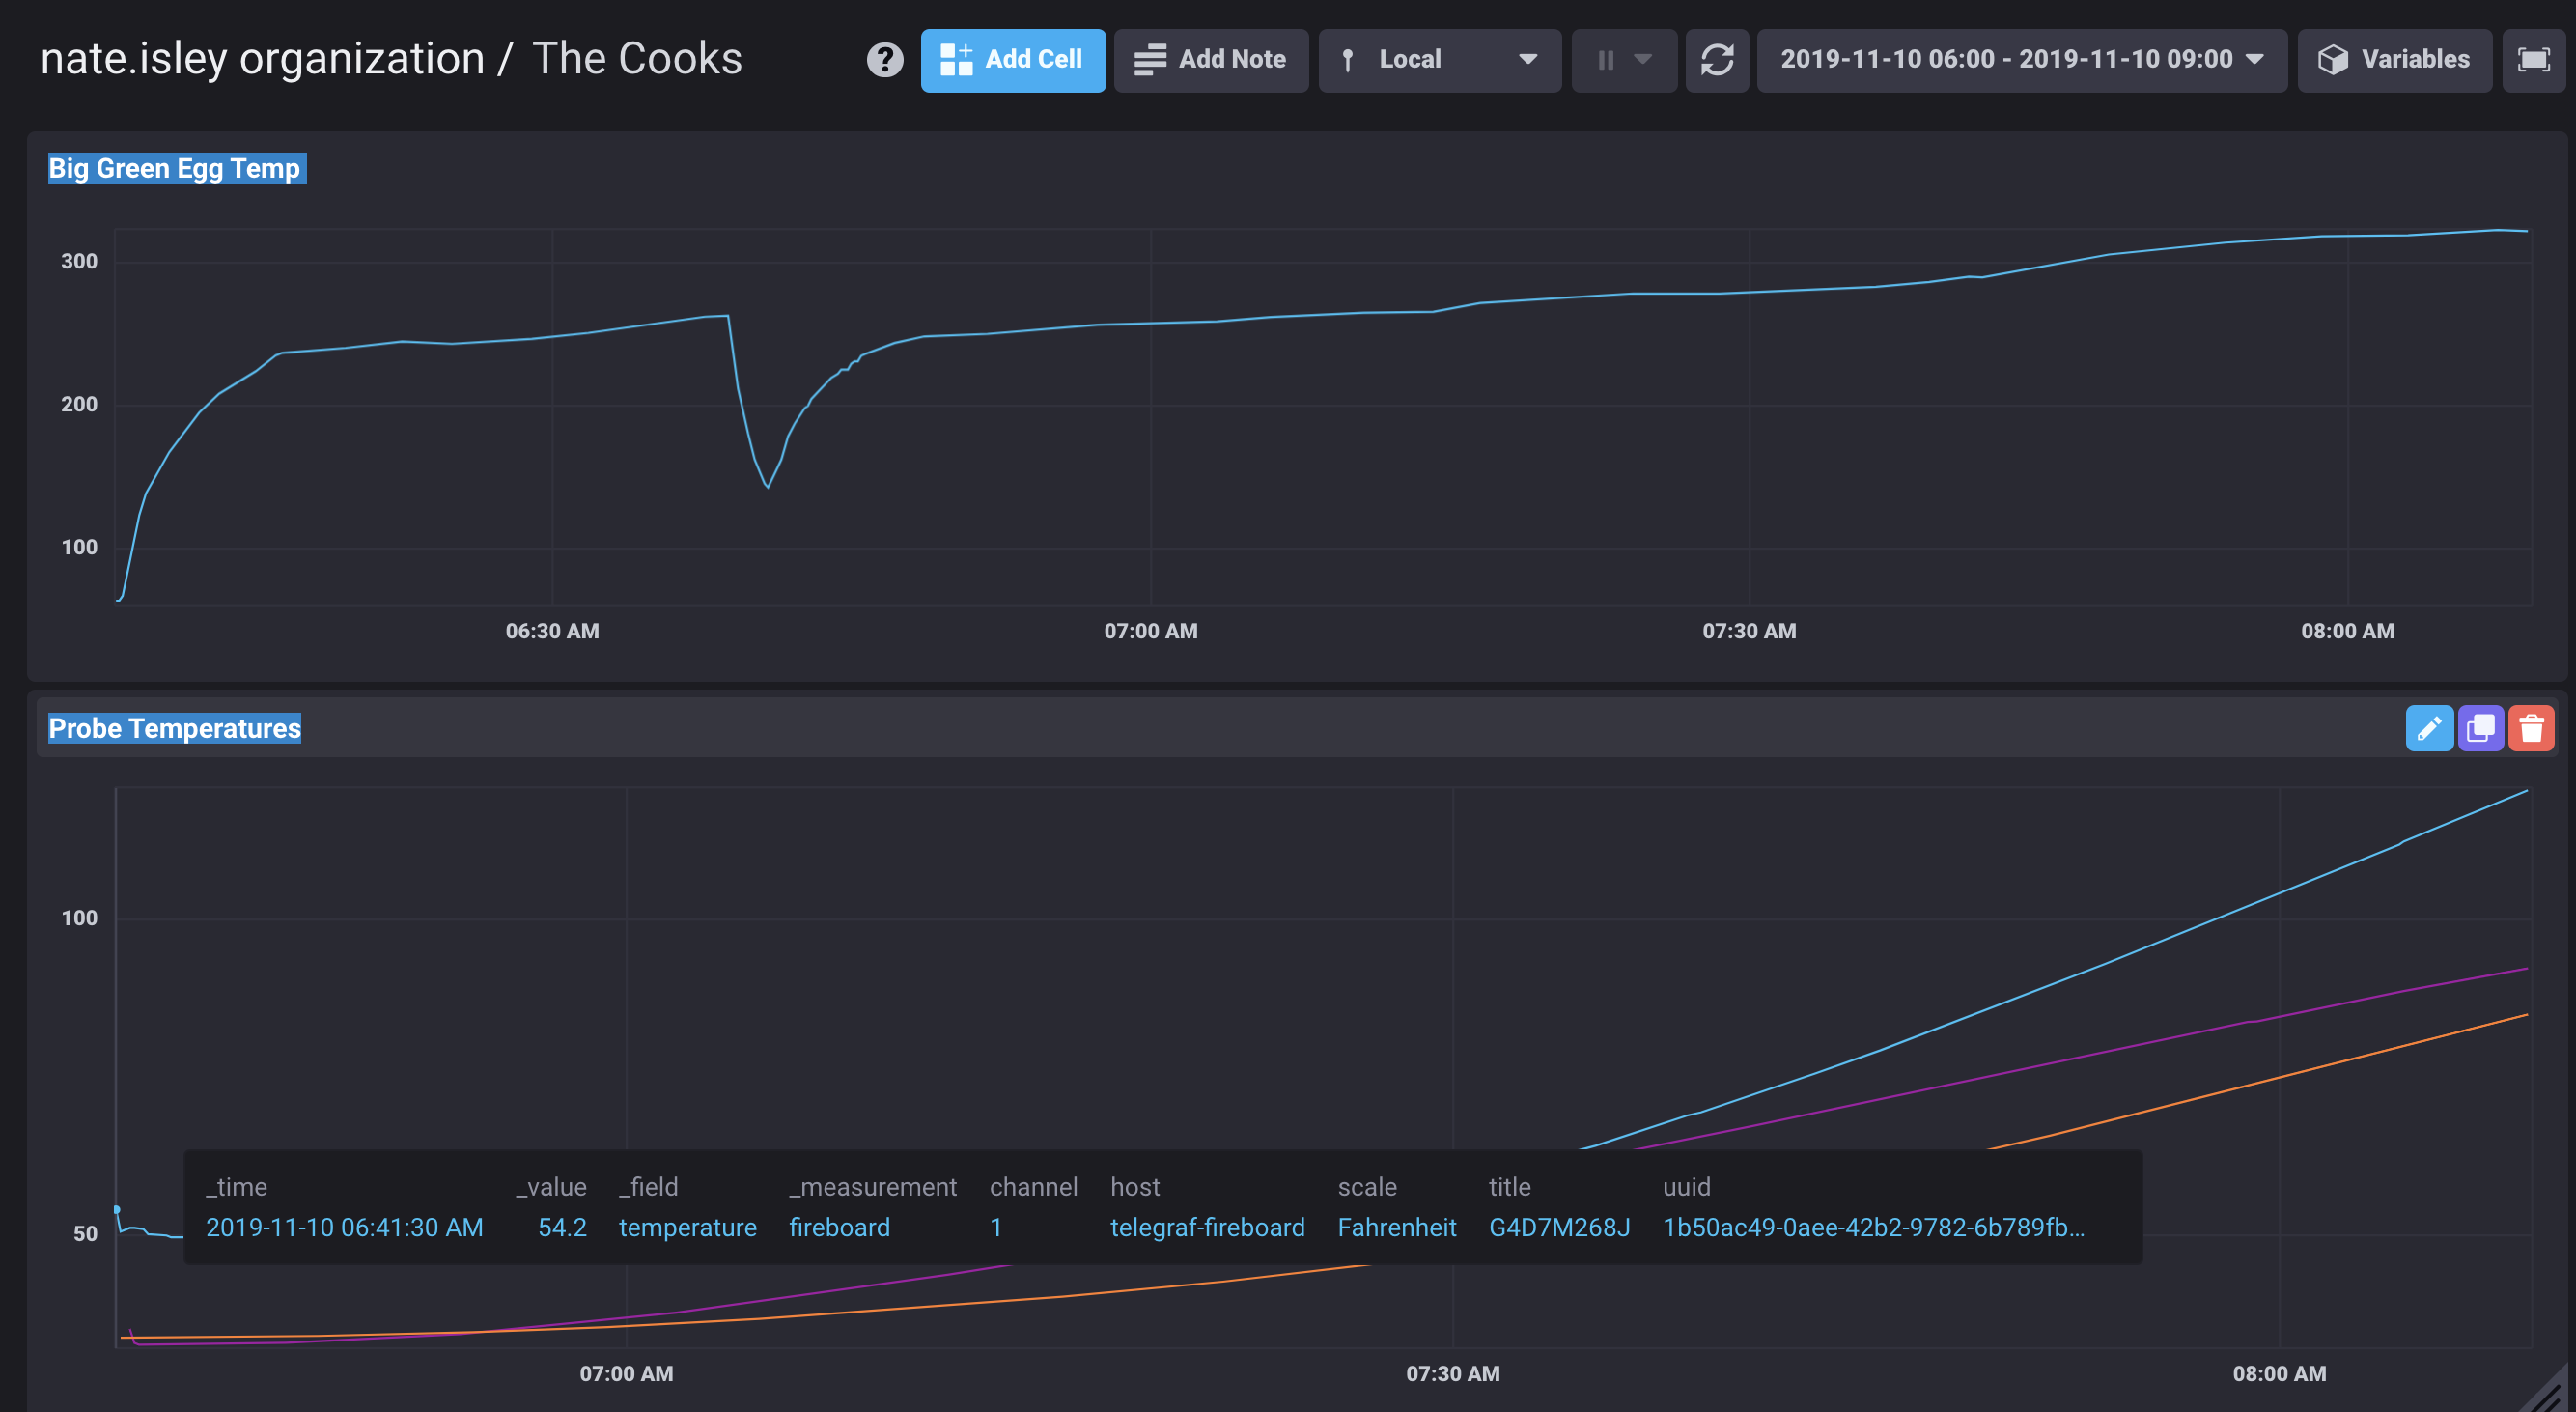
As a user using a dashboard, if I set the viewing time to 6am I would like all my graphs to start at 6am (even if there is no data)
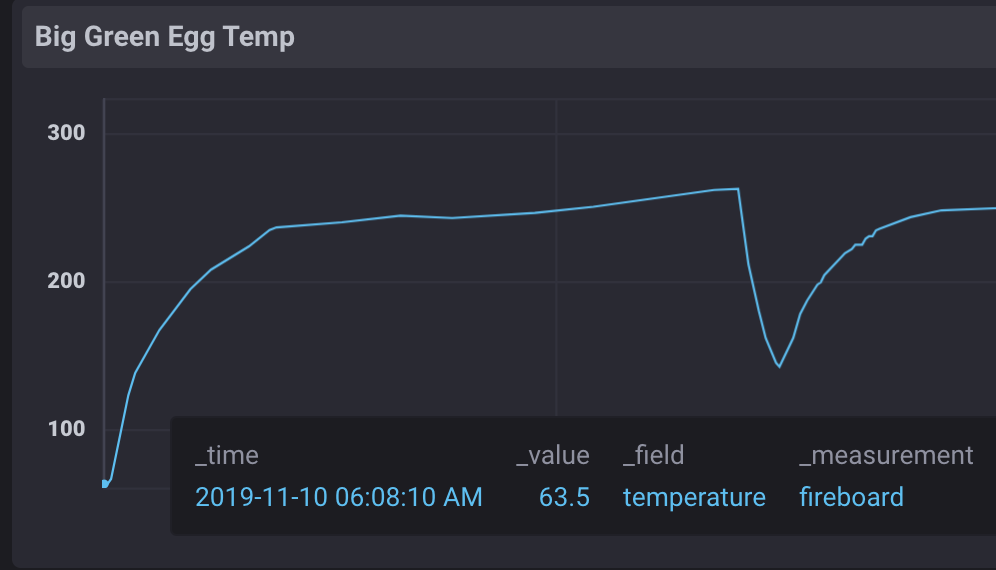
In the screenshot, the temps for the fire start flowing in at about 6:05am, but the meat isn't on until 6:40. Since the graphs don't align on the time range in the dashboard, it kind of messes up the whole use case.
Contributor guide
First steps
- Read the whole issue, then the project's contributing guide.
- Comment on the issue to say you are picking it up — it saves two people doing the same work.
- Fork the repository and make your change on a branch.
- Open a pull request that references the issue number.
Research direction
Start by reproducing the dashboard behavior described in the issue, using the screenshots as reference for the differing graph start times. Trace how the selected viewing time is applied across dashboard graphs. Done means every graph begins at the selected time, including when no data exists at that start.
Written by the indexing model from the issue text.
Assessment
- Domain
- data-visualization
- Issue type
- Feature
- Difficulty
- 4/5
- Estimated time
- 3-5 days
- Activity status
- Stale
- Clarity
- Mostly clear
- Newbie friendliness
- 35/100