influxdata / influxdata/giraffe
Y-axis should atleast add another value on the upper bound to avoid graph touching the edge
- Dominant language
- TypeScript
- Stars
- 189
- Forks
- 33
- Avg merge
- 3d 15h
- Merged PRs (30d)
- 4
Description
The max value in the chart should keep some margin visible on the Y-axis. In the screenshot, the max value is 43.81 and is touching the edge of the box.
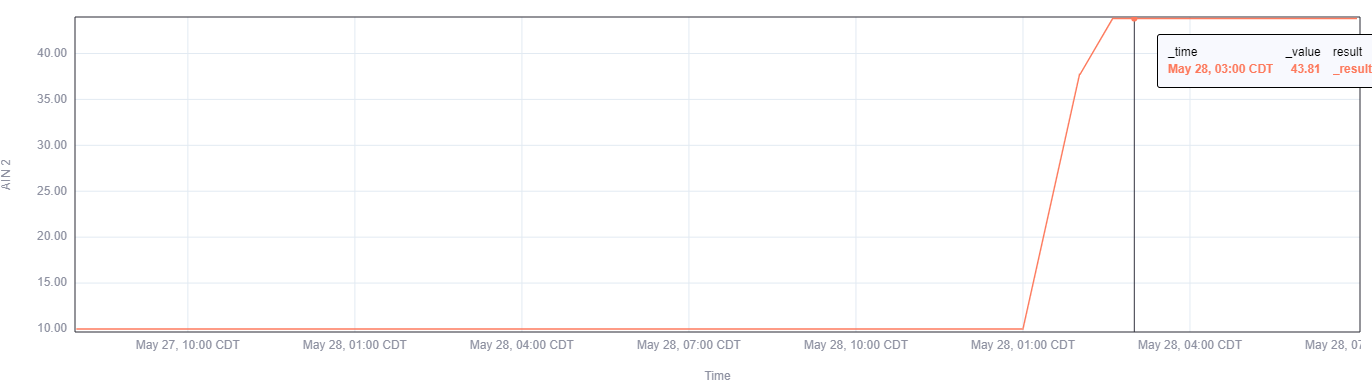
An ideal case would be to have the Y-axis automatically add `45` on the axis to add some margin on the chart
Contributor guide
Research direction
Start by locating the chart Y-axis scaling and tick-generation entry points in the TypeScript code, then reproduce the case shown in the issue with a maximum value of 43.81. Verify that the upper bound leaves visible margin and produces an appropriate next value such as 45, and check any existing chart tests if available.
Written by the indexing model from the issue text.
Assessment
- Tech stack
- typescript
- Domain
- data-visualization
- Issue type
- Bug
- Difficulty
- 3/5
- Estimated time
- 1-2 days
- Activity status
- Stale
- Clarity
- Mostly clear
- Newbie friendliness
- 42/100