influxdata / influxdata/giraffe
Show individual points in line graphs when possible
- Dominant language
- TypeScript
- Stars
- 189
- Forks
- 33
- Avg merge
- 3d 15h
- Merged PRs (30d)
- 4
Description
Right now, we show the individual points on a line graph when during a hover:
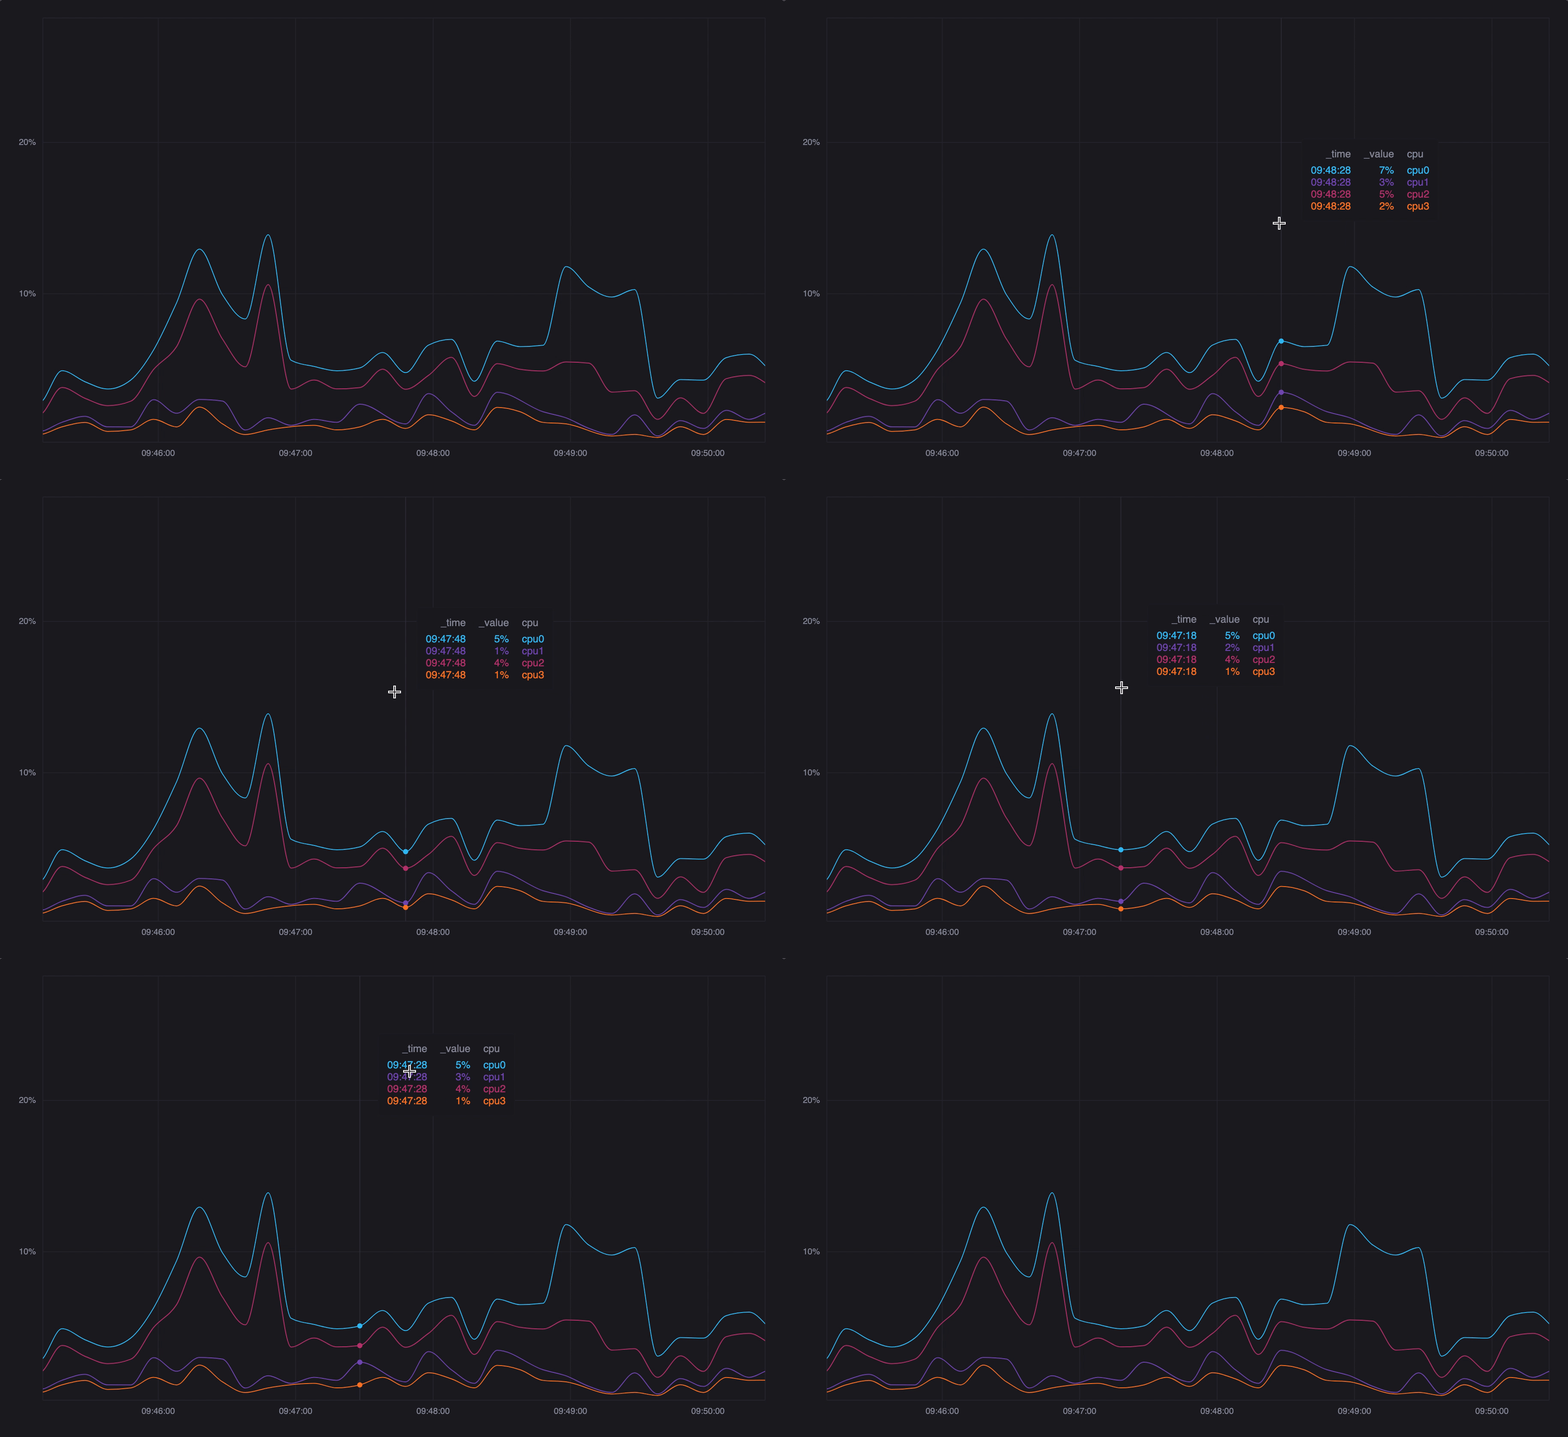
We should add an option to line graphs to show _all_ points that make up a line, not just the currently hovered points, whenever there is space.
This will help users who end up plotting lines with only a single point, as well as users who want to see their actual data set as part of an interpolated line.
- [ ] Points should only show when for every line in the line layer, each point in the line is at least `2 * pointRadius` away from all other points in the line
- [ ] Update the points to have a "hollowed out appearance":
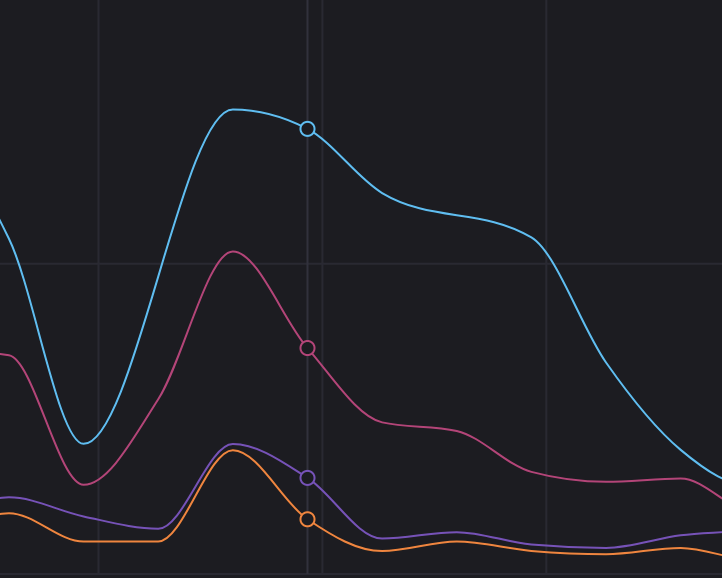
The hovered state of the point should put a dot in the center of the point.
Contributor guide
Research direction
No files or tests are named. Start by locating the line-graph rendering and hover-point behavior, then trace how line-graph options are configured. Done means an option can show hollow points when the spacing rule holds for every line, with a centered dot on hover, while avoiding overlap.
Written by the indexing model from the issue text.
Assessment
- Tech stack
- typescript
- Domain
- data-visualization, frontend
- Issue type
- Feature
- Difficulty
- 4/5
- Estimated time
- 3-5 days
- Activity status
- Stale
- Clarity
- Mostly clear
- Newbie friendliness
- 35/100