influxdata / influxdata/giraffe
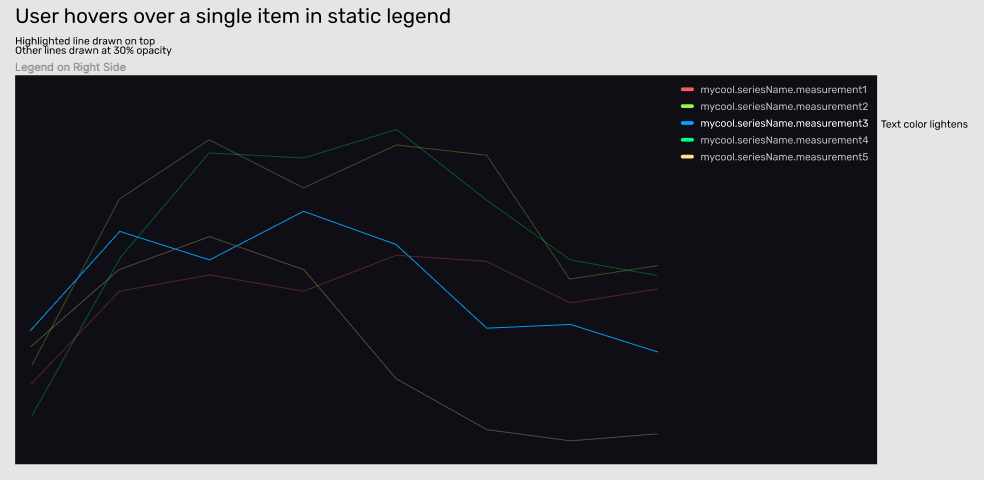
Graph Legend: Hover over series to highlight series on graph temporarily
- Dominant language
- TypeScript
- Stars
- 189
- Forks
- 33
- Avg merge
- 3d 15h
- Merged PRs (30d)
- 4
Description
### Background
Hovering over a legend should highlight the series on the graph. See #494
### Acceptance Criteria
- Hovering over a series on the legend highlights that series on the graph
- The highlighted series is rendered last so that it appears to be on top of the other lines
- Other lines are drawn at 30% opacity unless also highlighted (see https://github.com/influxdata/giraffe/issues/494)
Contributor guide
Research direction
Start by locating the graph legend and series-rendering entry points, then review the related behavior described in issue #494. Done means hovering a legend series highlights it, draws it last, and leaves non-highlighted lines at 30% opacity unless also highlighted.
Written by the indexing model from the issue text.
Assessment
- Tech stack
- typescript
- Domain
- data-visualization, frontend
- Issue type
- Feature
- Difficulty
- 4/5
- Estimated time
- 3-5 days
- Activity status
- Stale
- Clarity
- Mostly clear
- Newbie friendliness
- 45/100