influxdata / influxdata/giraffe
Visualization: Map overlay (Feature request)
- Dominant language
- TypeScript
- Stars
- 189
- Forks
- 33
- Avg merge
- 3d 15h
- Merged PRs (30d)
- 4
Description
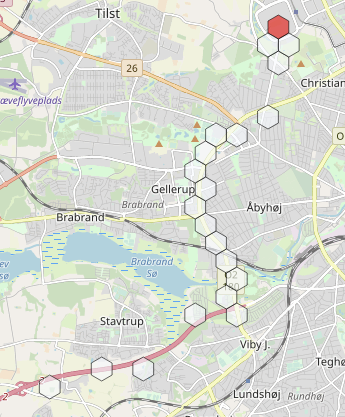
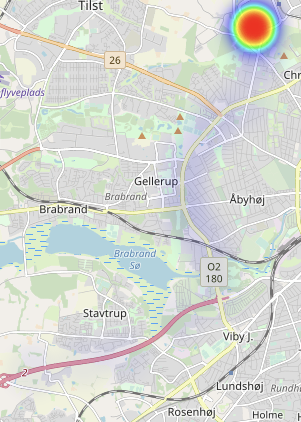
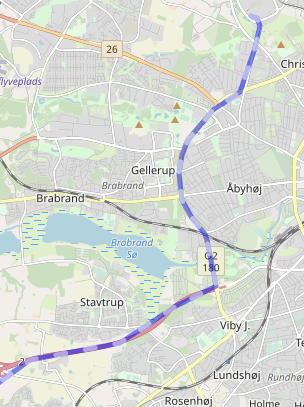
Now that we have geotemporal support in InfluxDB, it'd be great if we could allow users to create a cell displaying points on map.
Here is a Grafana panel with some ideas: https://grafana.com/grafana/plugins/alexandra-trackmap-panel
Some specific requests:
1) Each point should have an optional color-code mapping.
2) Each point should have an optional opacity mapping.
3) Each point should have an optional shape mapping.
4) Each point should have an optional size mapping.
5) Each point should have an option to display a text string (optional prefix, cell value, optional suffic).
6) All mappings (color, opacity, shape, size) should work for numeric or string/regex data.
7) Numeric mappings should support both > and >=
8) All mappings can come from any column in the result table.
9) Visualization should allow user to specify latitude/longitude to display, or have an "auto" option that sets the lat/long to just enough to display all datapoints.
Contributor guide
Research direction
No source files, tests, or entry points are named in the issue. Start with the linked Grafana trackmap panel and compare its behavior with the nine mapping and viewport requirements. Done means a map visualization can display geotemporal points with the requested mappings, labels, and automatic or user-specified bounds.
Written by the indexing model from the issue text.
Assessment
- Tech stack
- typescript
- Domain
- data-visualization, frontend
- Issue type
- Feature
- Difficulty
- 5/5
- Estimated time
- Over a week
- Activity status
- Stale
- Clarity
- Mostly clear
- Newbie friendliness
- 30/100