influxdata / influxdata/giraffe
Visualization: Colorized Thresholds for any column in table (feature request)
- Dominant language
- TypeScript
- Stars
- 189
- Forks
- 33
- Avg merge
- 3d 15h
- Merged PRs (30d)
- 4
Description
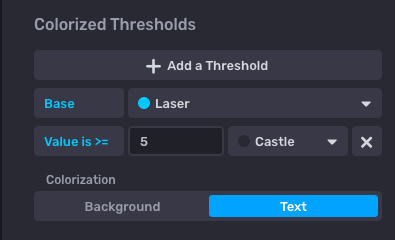
Today, InfluxDB tables allow you to set a colorized threshold, but it's unclear for which column. _value perhaps? Also, thresholds only work for columns with numeric data, not strings. See example below.
Grafana Boom Table Panel (https://grafana.com/grafana/plugins/yesoreyeram-boomtable-panel) allows you to colorize multiple columns:
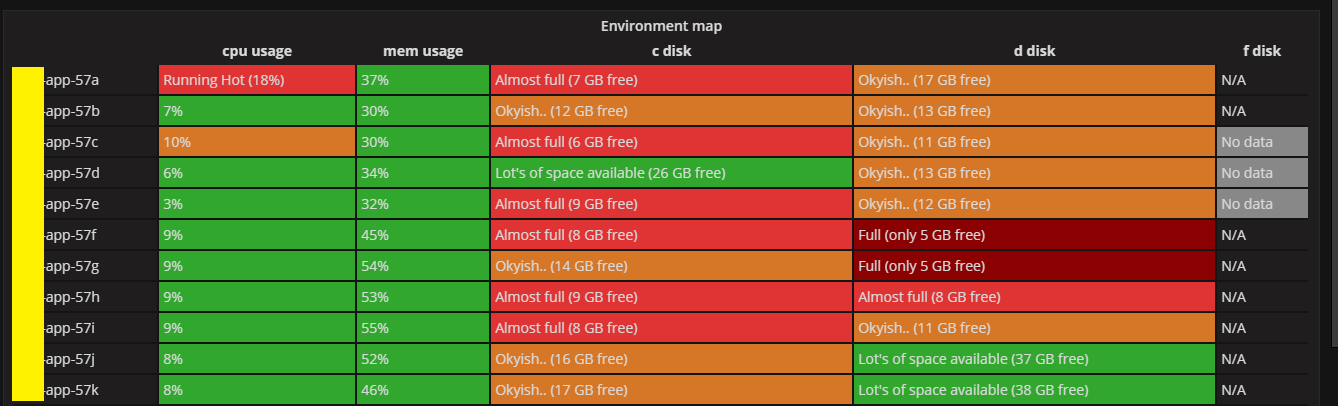
It'd be great if a dashboard creator could setup the following in their tables:
1) Specify a colorized threshold for _any_ column in a table (not just _value).
2) Specify colorization thresholds as >= or >
3) Map colorization rules to strings or regexes.
4) Setup one colorization rule for each column in a table.
Contributor guide
Research direction
No files, tests, or entry points are identified in the issue. Start by locating table visualization threshold handling in the Giraffe codebase, then review how columns and cell values are represented. Done means the four requested rule types are supported for independently configured table columns, with coverage for numeric, string, and regex cases.
Written by the indexing model from the issue text.
Assessment
- Tech stack
- typescript
- Domain
- data-visualization
- Issue type
- Feature
- Difficulty
- 5/5
- Estimated time
- Over a week
- Activity status
- Stale
- Clarity
- Mostly clear
- Newbie friendliness
- 25/100