influxdata / influxdata/giraffe
Table + Single Stat Control
- Dominant language
- TypeScript
- Stars
- 189
- Forks
- 33
- Avg merge
- 3d 15h
- Merged PRs (30d)
- 4
Description
There are tables that present one or more field values which are organized by some number of unique tags and tag values. A handy optimization of this would be to allow the user to specify a single field value to summarize and maintain. Here is an example of such a control:
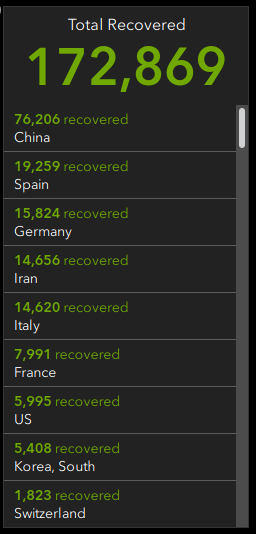
I believe there may be some challenges associated with the orientation of the table and the number of rows that are visible. In the example provided, the data is presented vertically.
The current workaround is to create a table and a separate single stat cells and orient them near each other. But, the amount of work to set that up vs. having a single integrated visualization seems like an area we could deliver a better "time to awesome."
Contributor guide
Research direction
The issue does not name files, tests, or an entry point; begin by locating the table and single-stat visualization controls in the repository. Clarify the table orientation, visible-row behavior, and supported field-value configuration before implementation. Done means one integrated control can summarize and maintain a selected field value without requiring separate table and single-stat cells.
Written by the indexing model from the issue text.
Assessment
- Tech stack
- typescript
- Domain
- data-visualization
- Issue type
- Feature
- Difficulty
- 5/5
- Estimated time
- Over a week
- Activity status
- Stale
- Clarity
- Needs clarification
- Newbie friendliness
- 25/100