influxdata / influxdata/giraffe
Add support for candlestick chart
Nobody has claimed this yet.
- Dominant language
- TypeScript
- Stars
- 189
- Forks
- 33
- Avg merge
- 3d 15h
- Merged PRs (30d)
- 4
Description
__Proposal:__
I'd like the ability to represent multiple layers of data for a single point in time with the same metric. The one I desire are candle stick charts.
__Current behavior:__
Does not exist as far as I can tell.
__Desired behavior:__
Be able to show layers of data for single point in time.
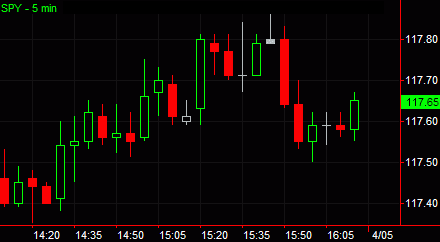
an example above is for financial market data. The fat part of the candlestick is the difference between open/close price (filled in color means losses for the day and vice versa for unfilled/gains). The lines that extend from there are the mins and max. This is useful for a number of applications beyond finance.
__Alternatives considered:__
Open to any and all possibilities
__Use case:__
Like to be able to show compelling visualizations to make decisions on that create value for me the end user.
short intro to candlestick charts: https://www.investopedia.com/trading/candlestick-charting-what-is-it/
Contributor guide
First steps
- Read the whole issue, then the project's contributing guide.
- Comment on the issue to say you are picking it up — it saves two people doing the same work.
- Fork the repository and make your change on a branch.
- Open a pull request that references the issue number.
Research direction
The issue names no files, tests, or entry points. Start by locating the existing chart and series implementations in the TypeScript project, then review how a time point currently maps to displayed data. Done means the project can represent and render candlestick values, including open, close, minimum, and maximum layers, with tests or an example covering the result.
Written by the indexing model from the issue text.
Assessment
- Tech stack
- typescript
- Domain
- data-visualization
- Issue type
- Feature
- Difficulty
- 5/5
- Estimated time
- Over a week
- Activity status
- Stale
- Clarity
- Needs clarification
- Newbie friendliness
- 25/100