Double Indicators
- Dominant language
- Dart
- Stars
- 7.6k
- Forks
- 2k
- Avg merge
- 9d 1h
- Merged PRs (30d)
- 2
Description
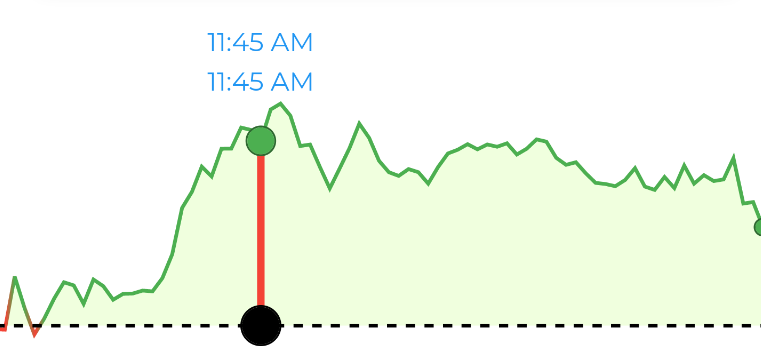
I read the documentation and I have seen that using the `ShowingTooltipIndicators()` should be the solution to show only one indicator.
However, here is my code :
` LineChartData(
showingTooltipIndicators: [
ShowingTooltipIndicators(coordinates.map((flspot) {
return LineBarSpot(
// returnMainGraph is the green light graph
// I did not insert dashed graph here with the purpose to show only one indicator
returnMainGraph(coordinates, colorList),
1,
flspot
);
}).toList()),
],
`
And here is the screenshot:
Contributor guide
Research direction
Start with LineChartData's showingTooltipIndicators and the ShowingTooltipIndicators and LineBarSpot entry points shown in the report. Reproduce the supplied coordinates and returnMainGraph example, then compare the rendered indicators with the screenshot. Done means the configuration displays only the intended single indicator.
Written by the indexing model from the issue text.
Assessment
- Tech stack
- dart, flutter
- Domain
- data-visualization, frontend
- Issue type
- Bug
- Difficulty
- 3/5
- Estimated time
- 1-2 days
- Activity status
- Stale
- Clarity
- Mostly clear
- Newbie friendliness
- 35/100