BarChart crashes on high values
- Dominant language
- Dart
- Stars
- 7.6k
- Forks
- 2k
- Avg merge
- 9d 1h
- Merged PRs (30d)
- 2
Description
Using BarChart with high values does not display
The set of data who I'm using is arround values of 500000 or more, if I divide by 1000, the chart is works fine
This is the set of data divided by 1000
`
void _loadData(Map>> d) {
_data = {};
List rawBarGroups = [];
// Groups
int x = 0;
double max = 0;
for (Map> values in d.values) {
double y1 = values["A"]!["value"] as double,
y2 = values["B"]!["value"] as double,
y3 = values["C"]!["value"] as double,
y4 = values["D"]!["value"] as double;
if (max < y1) {
max = y1;
}
if (max < y2) {
max = y2;
}
if (max < y3) {
max = y3;
}
if (max < y4) {
max = y4;
}
rawBarGroups.add(
makeGroupData(
x,
y1 / 1000,
y2 / 1000,
y3 / 1000,
y4 / 1000,
),
);
x++;
}
_max = max / 1000;
_showingBarGroups = rawBarGroups;
_data = d;
}
BarChartGroupData makeGroupData(
int x, double y1, double y2, double y3, double y4) {
double width = 18;
return BarChartGroupData(
barsSpace: 12,
x: x,
barRods: [
BarChartRodData(
toY: y1,
color: _aBarColor,
width: width,
),
BarChartRodData(
toY: y2,
color: _bBarColor,
width: width,
),
BarChartRodData(
toY: y3,
color: _cBarColor,
width: width,
),
BarChartRodData(
toY: y4,
color: _dBarColor,
width: width,
),
],
);
}
`
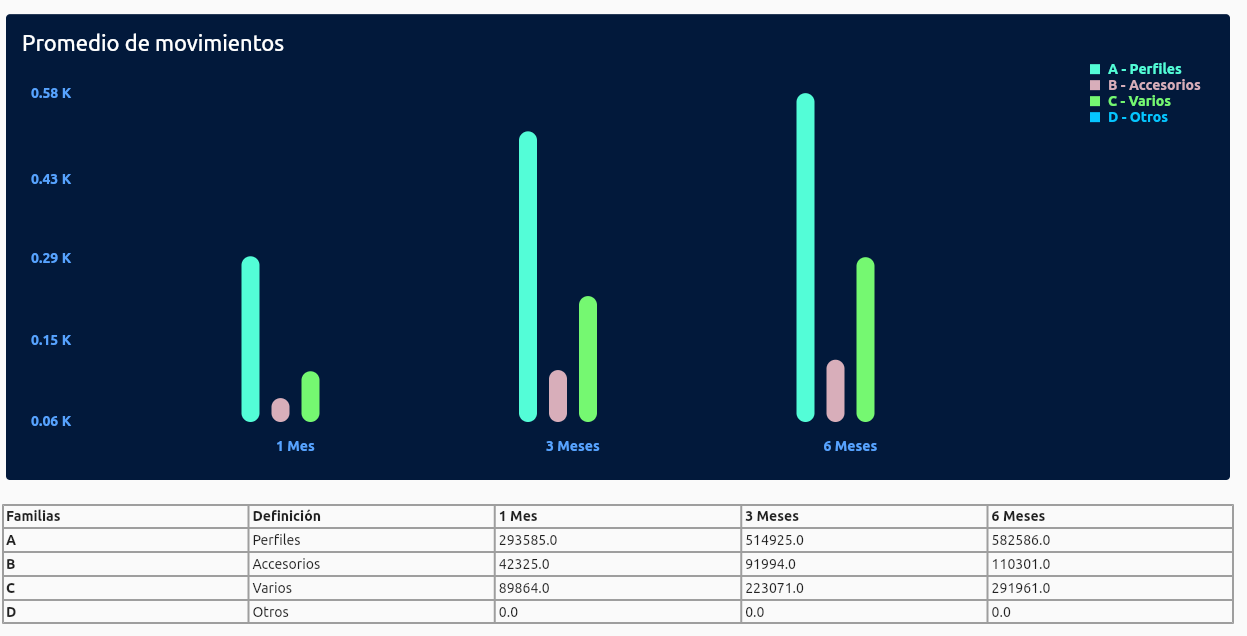
When I do not divide the values
`
void _loadData(Map>> d) {
_data = {};
List rawBarGroups = [];
// Groups
int x = 0;
double max = 0;
for (Map> values in d.values) {
double y1 = values["A"]!["value"] as double,
y2 = values["B"]!["value"] as double,
y3 = values["C"]!["value"] as double,
y4 = values["D"]!["value"] as double;
if (max < y1) {
max = y1;
}
if (max < y2) {
max = y2;
}
if (max < y3) {
max = y3;
}
if (max < y4) {
max = y4;
}
rawBarGroups.add(
makeGroupData(
x,
y1,
y2,
y3,
y4,
),
);
x++;
}
_max = max;
_showingBarGroups = rawBarGroups;
_data = d;
}
`

The app seems to be frozen.
The version is 0.55.2
Contributor guide
Research direction
Start by reproducing the report with BarChart and BarChartRodData using values around 500000, comparing the divided and undivided examples. Trace the BarChart rendering path to identify why the high-value chart freezes; done means the chart displays those values without requiring manual division, with regression coverage if an existing test location is found.
Written by the indexing model from the issue text.
Assessment
- Tech stack
- dart, flutter
- Domain
- frontend
- Issue type
- Bug
- Difficulty
- 3/5
- Estimated time
- 1-2 days
- Activity status
- Stale
- Clarity
- Mostly clear
- Newbie friendliness
- 35/100