Setting Padding on BarChart widget shrinks bar chart groups
- Dominant language
- Dart
- Stars
- 7.6k
- Forks
- 2k
- Avg merge
- 9d 1h
- Merged PRs (30d)
- 2
Description
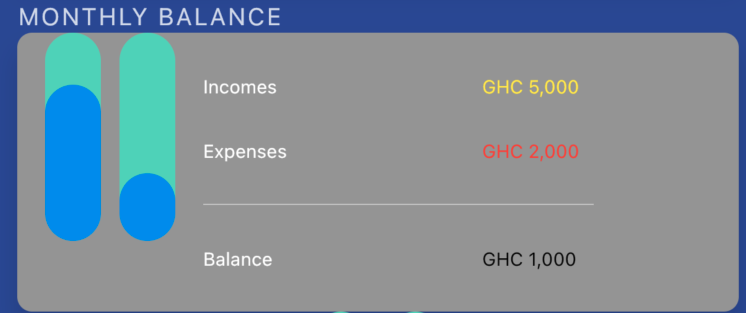
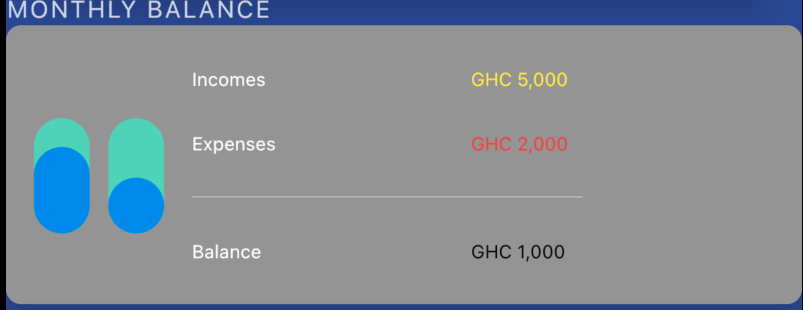
I am trying to set a padding at the top of the bar chart to allow it to come down a bit, but setting the padding reduces the overall size of the bar groups. The bar groups are in a Sizedbox widget which is sharing space with another column within in a parent row
This is a screenshot of the output without the padding
And this is the screenshot with the padding
This is my code below
````
import 'dart:math';
import 'package:bood/utils/color_extensions.dart';
import 'package:fl_chart/fl_chart.dart';
import 'package:flutter/material.dart';
class BarChartSample1 extends StatefulWidget {
const BarChartSample1({Key? key}) : super(key: key);
@override
State createState() => BarChartSample1State();
}
class BarChartSample1State extends State {
final Color barBackgroundColor = const Color(0xff72d8bf);
final Duration animDuration = const Duration(milliseconds: 250);
int touchedIndex = -1;
@override
Widget build(BuildContext context) {
return Column(
crossAxisAlignment: CrossAxisAlignment.start,
mainAxisAlignment: MainAxisAlignment.spaceEvenly,
children: [
Text(
"MONTHLY BALANCE",
style: TextStyle(
letterSpacing: 1,
color: Colors.white.withOpacity(0.8),
fontSize: 13),
),
Container(
height: 150.0,
decoration: BoxDecoration(
color: Colors.grey,
shape: BoxShape.rectangle,
borderRadius: BorderRadius.circular(8.0),
boxShadow: [
BoxShadow(
color: Colors.black12,
blurRadius: 10.0,
offset: Offset(0.0, 10.0),
),
],
),
child: Row(
mainAxisAlignment: MainAxisAlignment.spaceEvenly,
children: [
SizedBox(
width: 100,
height: 150,
child: Padding(
padding: const EdgeInsets.only(top: 50.0),
child: BarChart(
mainBarData(),
swapAnimationDuration: animDuration,
),
),
),
Expanded(
child: Column(
crossAxisAlignment: CrossAxisAlignment.start,
mainAxisAlignment: MainAxisAlignment.spaceEvenly,
children: [
Row(
children: [
SizedBox(
width: 150,
child: Text(
"Incomes",
style: TextStyle(
fontSize: 10, color: Colors.white),
)),
SizedBox(
child: Text("GHC 5,000",
style: TextStyle(
fontSize: 10, color: Colors.yellow)),
),
],
),
Row(
// mainAxisAlignment: MainAxisAlignment.spaceBetween,
children: [
SizedBox(
width: 150,
child: Text(
"Expenses",
style: TextStyle(
fontSize: 10, color: Colors.white),
)),
SizedBox(
child: Text("GHC 2,000",
style: TextStyle(
fontSize: 10, color: Colors.red)),
),
],
),
//Divider for Income, Expenses and Balance
SizedBox(
width: 210,
child: Divider(
height: 0.7,
color: Colors.white,
thickness: 0.3,
),
),
Row(
children: [
SizedBox(
width: 150,
child: Text(
"Balance",
style: TextStyle(
fontSize: 10, color: Colors.white),
)),
SizedBox(
child: Text("GHC 1,000",
style: TextStyle(
fontSize: 10, color: Colors.black)),
),
],
),
],
),
)
]),
)
]);
}
BarChartGroupData makeGroupData(
int x,
double y, {
bool isTouched = false,
Color barColor = Colors.blue,
double width = 30,
List showTooltips = const [],
}) {
return BarChartGroupData(
x: x,
barRods: [
BarChartRodData(
toY: isTouched ? y + 1 : y,
color: isTouched ? Colors.yellow : barColor,
width: width,
borderSide: isTouched
? BorderSide(color: Colors.yellow.darken(), width: 1)
: const BorderSide(color: Colors.blue, width: 0),
backDrawRodData: BackgroundBarChartRodData(
show: true,
toY: 20,
color: barBackgroundColor,
),
),
],
showingTooltipIndicators: showTooltips,
);
}
List showingGroups() => List.generate(2, (i) {
switch (i) {
case 0:
return makeGroupData(0, 15, isTouched: i == touchedIndex);
case 1:
return makeGroupData(1, 6.5, isTouched: i == touchedIndex);
default:
return throw Error();
}
});
BarChartData mainBarData() {
return BarChartData(
groupsSpace: 10,
alignment: BarChartAlignment.center,
barTouchData: BarTouchData(
touchTooltipData: BarTouchTooltipData(
tooltipBgColor: Colors.blueGrey,
getTooltipItem: (group, groupIndex, rod, rodIndex) {
String weekDay;
switch (group.x.toInt()) {
case 0:
weekDay = 'Monday';
break;
case 1:
weekDay = 'Tuesday';
break;
default:
throw Error();
}
return BarTooltipItem(
weekDay + ' \n',
const TextStyle(
color: Colors.blue,
fontWeight: FontWeight.bold,
fontSize: 18,
),
children: [
TextSpan(
text: (rod.toY - 1).toString(),
style: const TextStyle(
color: Colors.yellow,
fontSize: 16,
fontWeight: FontWeight.w500,
),
),
],
);
}),
touchCallback: (FlTouchEvent event, barTouchResponse) {
setState(() {
if (!event.isInterestedForInteractions ||
barTouchResponse == null ||
barTouchResponse.spot == null) {
touchedIndex = -1;
return;
}
touchedIndex = barTouchResponse.spot!.touchedBarGroupIndex;
});
},
),
titlesData: FlTitlesData(
show: true,
rightTitles: AxisTitles(
sideTitles: SideTitles(showTitles: false),
),
topTitles: AxisTitles(
sideTitles: SideTitles(showTitles: false),
),
bottomTitles: AxisTitles(
sideTitles: SideTitles(
showTitles: true,
getTitlesWidget: getTitles,
reservedSize: 38,
),
),
leftTitles: AxisTitles(
sideTitles: SideTitles(
showTitles: false,
),
),
),
borderData: FlBorderData(
show: false,
),
// minY: 0,
barGroups: showingGroups(),
gridData: FlGridData(
show: false,
// horizontalInterval: 5
),
);
}
Widget getTitles(double value, TitleMeta meta) {
const style = TextStyle(
color: Colors.black,
fontWeight: FontWeight.bold,
fontSize: 14,
);
Widget text;
switch (value.toInt()) {
case 0:
text = const Text('', style: style);
break;
case 1:
text = const Text('', style: style);
break;
default:
text = const Text('', style: style);
break;
}
return SideTitleWidget(
axisSide: meta.axisSide,
space: 16,
child: text,
);
}
BarChartData randomData() {
return BarChartData(
barTouchData: BarTouchData(
enabled: false,
),
titlesData: FlTitlesData(
show: true,
bottomTitles: AxisTitles(
sideTitles: SideTitles(
showTitles: true,
getTitlesWidget: getTitles,
reservedSize: 38,
),
),
leftTitles: AxisTitles(
sideTitles: SideTitles(
showTitles: false,
),
),
topTitles: AxisTitles(
sideTitles: SideTitles(
showTitles: false,
),
),
rightTitles: AxisTitles(
sideTitles: SideTitles(
showTitles: false,
),
),
),
borderData: FlBorderData(
show: false,
),
barGroups: List.generate(7, (i) {
switch (i) {
case 0:
return makeGroupData(0, Random().nextInt(15).toDouble() + 6,
barColor: Colors.purple);
case 1:
return makeGroupData(1, Random().nextInt(15).toDouble() + 6,
barColor: Colors.red);
default:
return throw Error();
}
}),
gridData: FlGridData(show: false),
);
}
}
```
**Versions**
-Flutter 3.0.5
-fl_chart: ^0.55.1
Contributor guide
Research direction
Start with the provided BarChartSample1 entry point, especially the SizedBox, Padding, and BarChart configuration, and reproduce the chart with and without top padding using fl_chart 0.55.1. Done means the requested top spacing no longer unexpectedly shrinks the bar groups while the chart remains within its allocated height.
Written by the indexing model from the issue text.
Assessment
- Tech stack
- dart, flutter
- Domain
- data-visualization, frontend
- Issue type
- Bug
- Difficulty
- 3/5
- Estimated time
- 1-2 days
- Activity status
- Stale
- Clarity
- Mostly clear
- Newbie friendliness
- 35/100