xticks/yticks argument does not work for hvplot heatmap
- Dominant language
- Python
- Stars
- 1.4k
- Forks
- 124
- Avg merge
- 1d 18h
- Merged PRs (30d)
- 1
Description
# Short description of issue
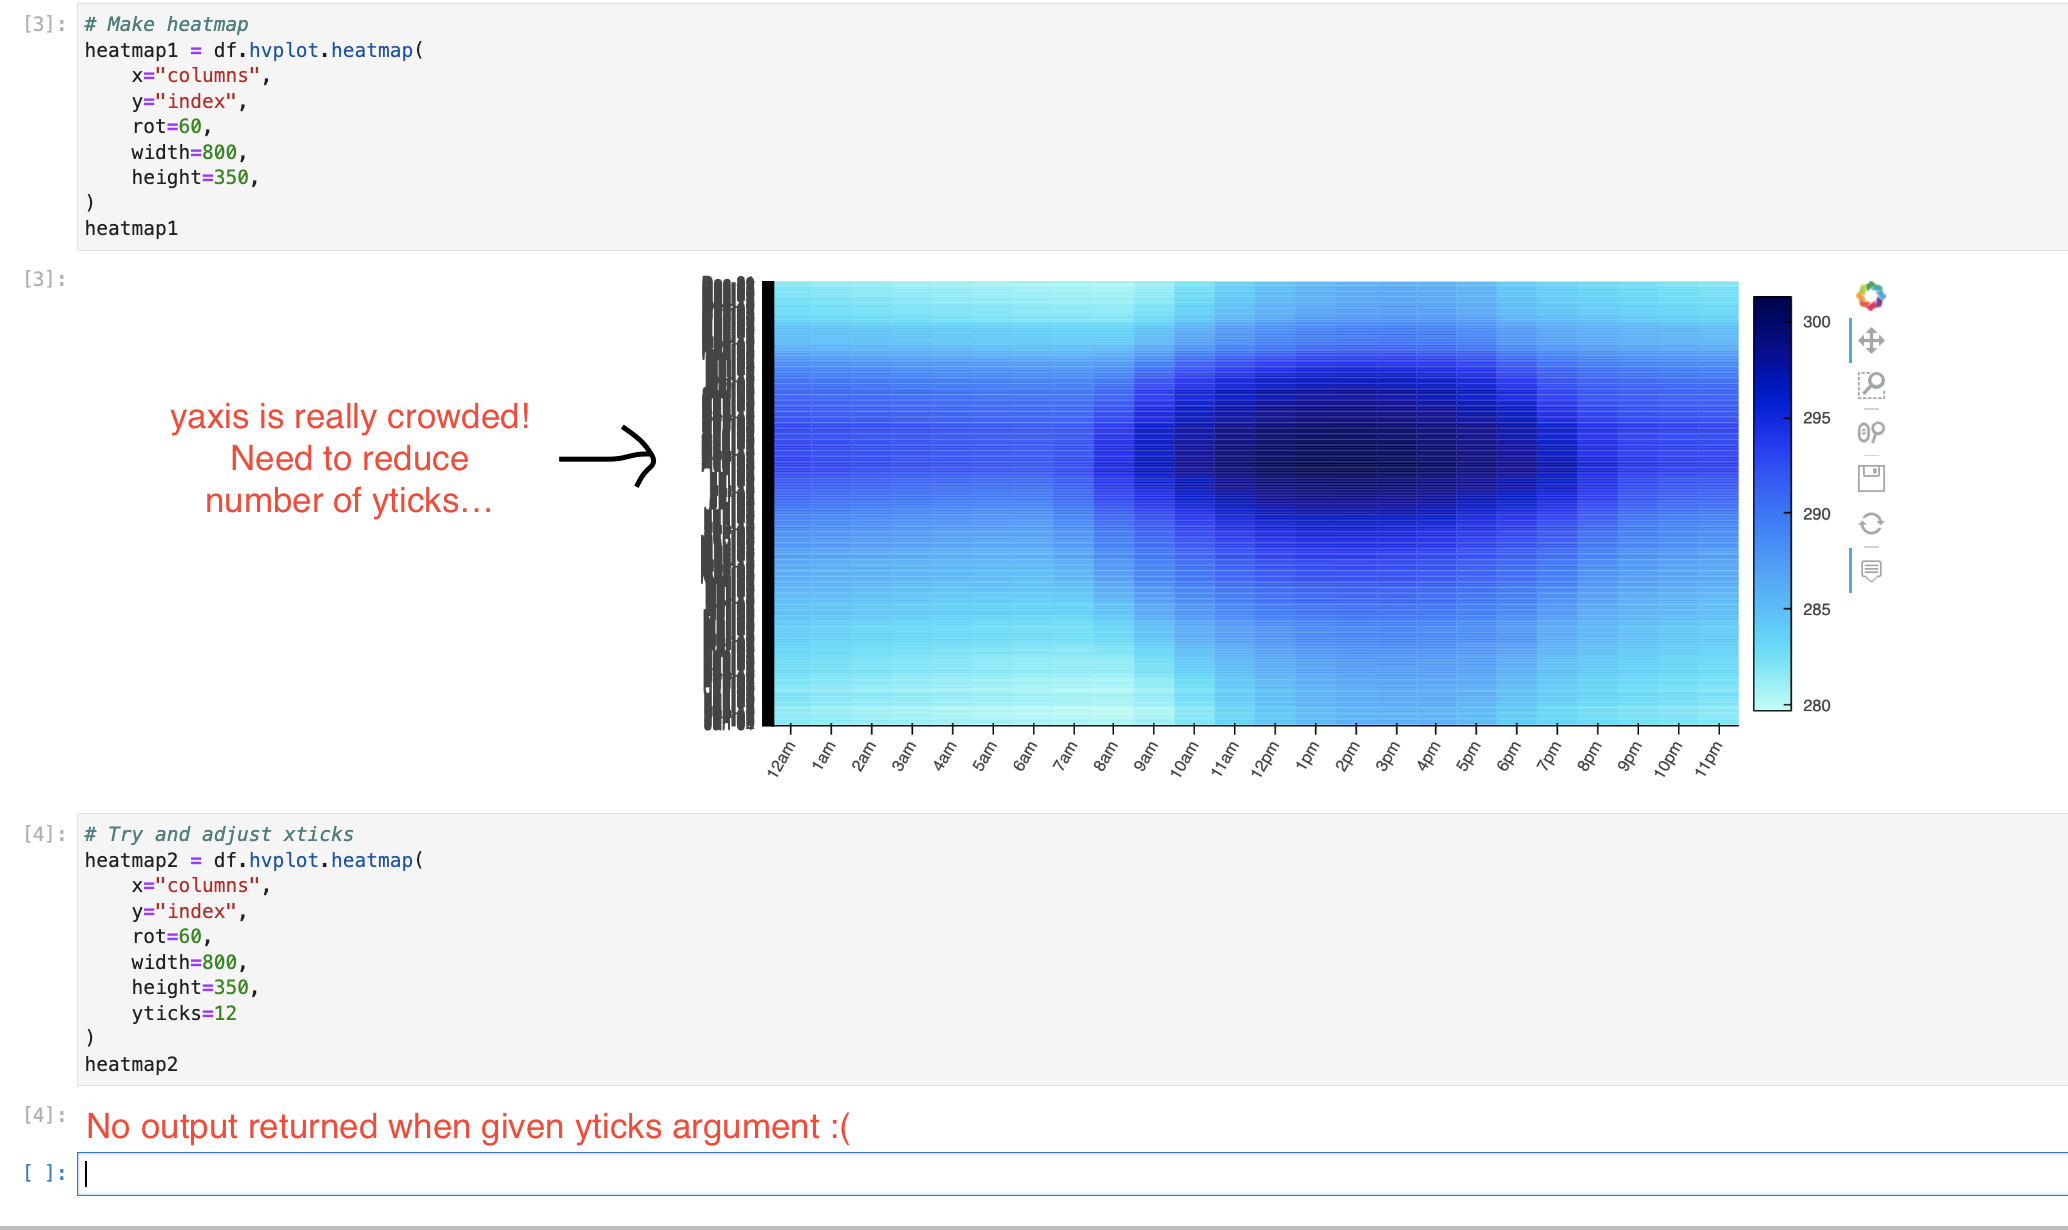
I really need to reduce the density of yticks on my heatmap. Supposedly, the `xticks` and `yticks` argument should be able to do this, but it doesn't work, and actually makes my plot disappear.
## Software version info
hvplot version: 0.8.0
pandas version: 1.3.4
## Complete, minimal, self-contained example code that reproduces the issue
Code is pasted below. A Jupyter Notebook with this code and data used by the notebook is also included.
**Zip file with data and notebook**: [data_and_notebook.zip](https://github.com/holoviz/hvplot/files/10061186/data_and_notebook.zip)
**Code snippet from notebook:**
```
df = pd.read_csv("tmy_data.csv", index_col="date") # Read data
heatmap2 = df.hvplot.heatmap( # Make plot
x="columns",
y="index",
rot=60,
width=800,
height=350,
yticks=12
)
heatmap2
```
## Screenshots or screencasts of the bug in action
## Description of expected behavior and the observed behavior
**Expected Behavior:** yticks argument reduces the number of yticks present if I feed it an integer value (i.e. if i set `yticks=10`, I should get back a heatmap with 10 yticks).
**Observed behavior:** No heatmap is returned
Contributor guide
Assessment
This issue has not been assessed yet.