Display units in the legend title
- Dominant language
- Python
- Stars
- 1.4k
- Forks
- 124
- Avg merge
- 1d 18h
- Merged PRs (30d)
- 1
Description
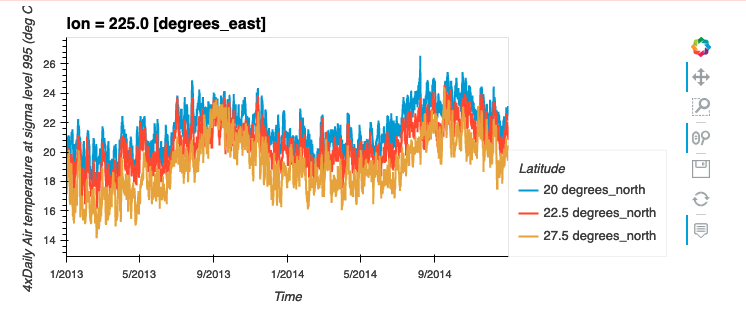
xarray displays the `units` *attr* in bracket in the legend title while hvplot displays it on every legend entry.
```python
import hvplot.xarray
import numpy as np
import pandas as pd
import matplotlib.pyplot as plt
import xarray as xr
airtemps = xr.tutorial.open_dataset("air_temperature")
air = airtemps.air - 273.15
air.attrs = airtemps.air.attrs
air.attrs["units"] = "deg C"
air.isel(lon=10, lat=[19, 21, 22]).plot.line(x="time")
```

`air.isel(lon=10, lat=[19, 21, 22]).hvplot.line(by='lat')`:
Contributor guide
Assessment
This issue has not been assessed yet.