Switch to categorical handling when color_key specified
- Dominant language
- Python
- Stars
- 1.4k
- Forks
- 124
- Avg merge
- 1d 18h
- Merged PRs (30d)
- 1
Description
This issue is one of a number that relate to datashader support of timeseries. In particular, this issue relates to https://github.com/holoviz/hvplot/issues/939 which is also about switching to categorical handling.
```
>>> hv.__version__, bokeh.__version__, ds.__version__, panel.__version__, hvplot.__version__
('1.15.1', '2.4.3', '0.14.2', '0.13.1', '0.8.1')
```
```python
>>> timestamps = [pd.Timestamp('2022-04-01 0{0}:00:00-0000'.format(hour)) for hour in range(10)]
>>> df = pd.DataFrame({'timestamp':timestamps, 'SPY':np.random.rand(10), 'NDAQ':np.random.rand(10)})
>>> melted = pd.melt(df, id_vars=['timestamp'], var_name='stock', value_name='high')
>>> melted['bond_indicator'] = melted['stock'].isin(['SPY'])
```
There are multiple problems illustrated here due to `color_key` not forcing categorical handling:
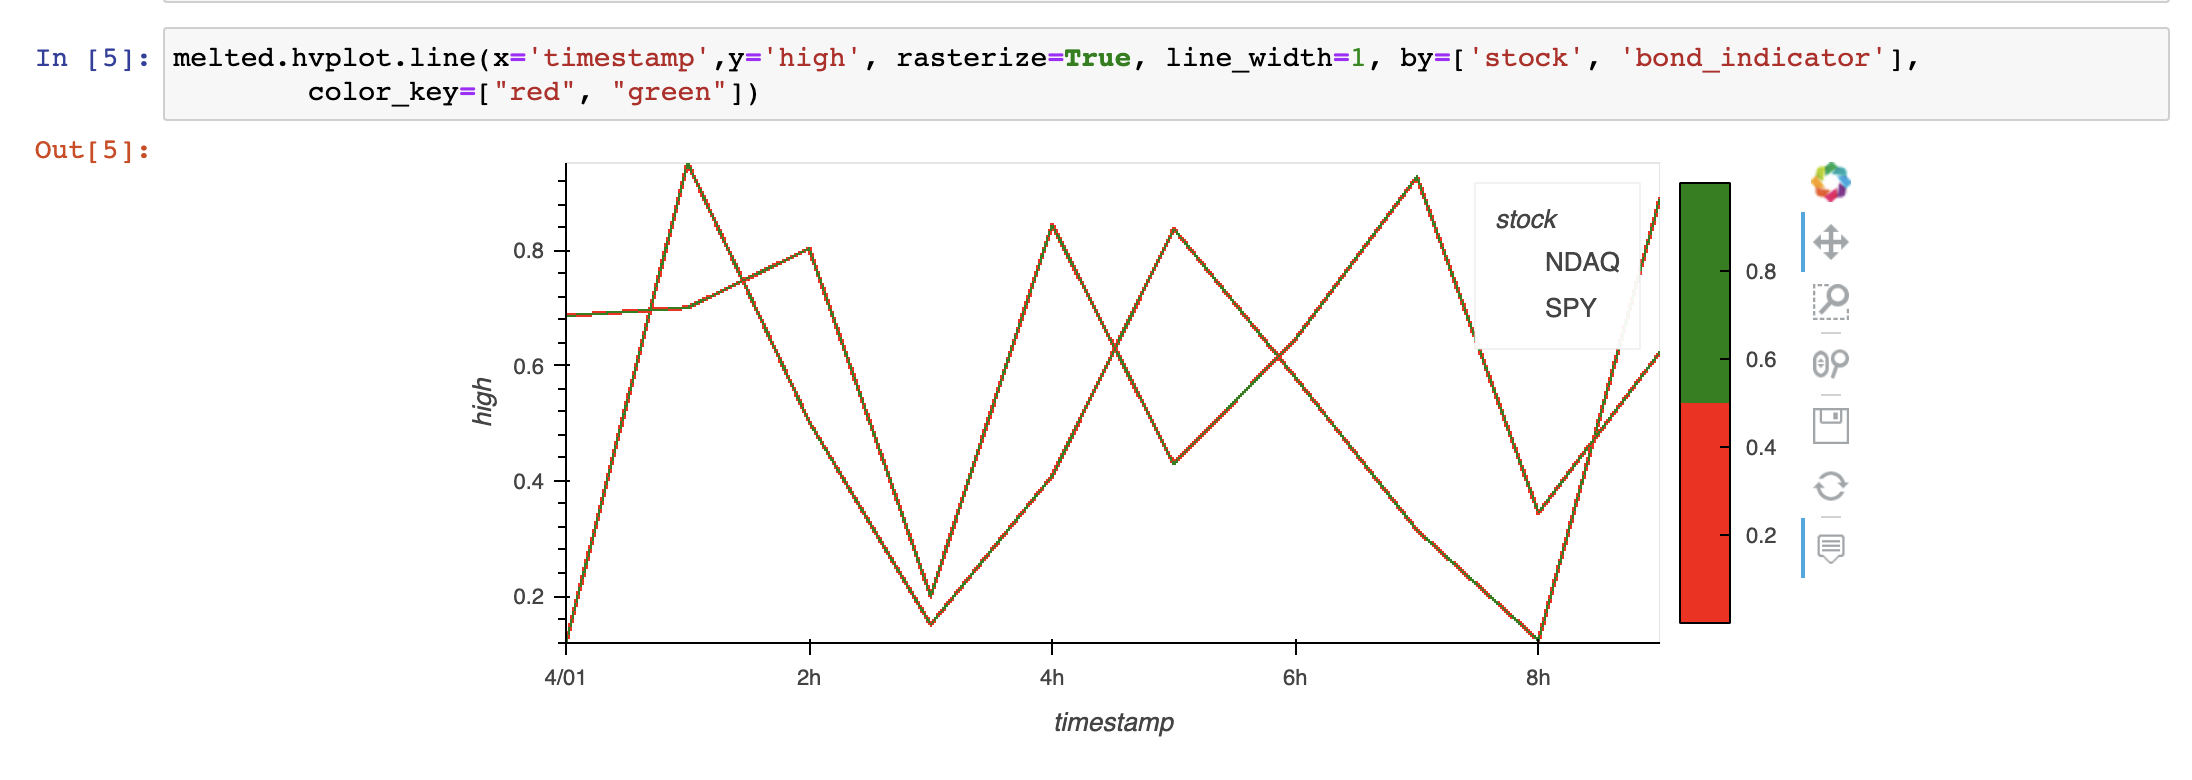
1. There is a colorbar when there shouldn't be one as this should be categorical (only two colors, red and green)
2. There is a legend but it isn't actually working properly (it is blank). This may just be bokeh having difficult showing legends for images.
3. There is a mixture of red and green for all the lines! This is because instead of being treated as a categorical, the curves are being antialiased (`line_width=1`) which gives you floats, with a stronger value in the middle of the line and lower values near the antialiased, fuzzy edges.
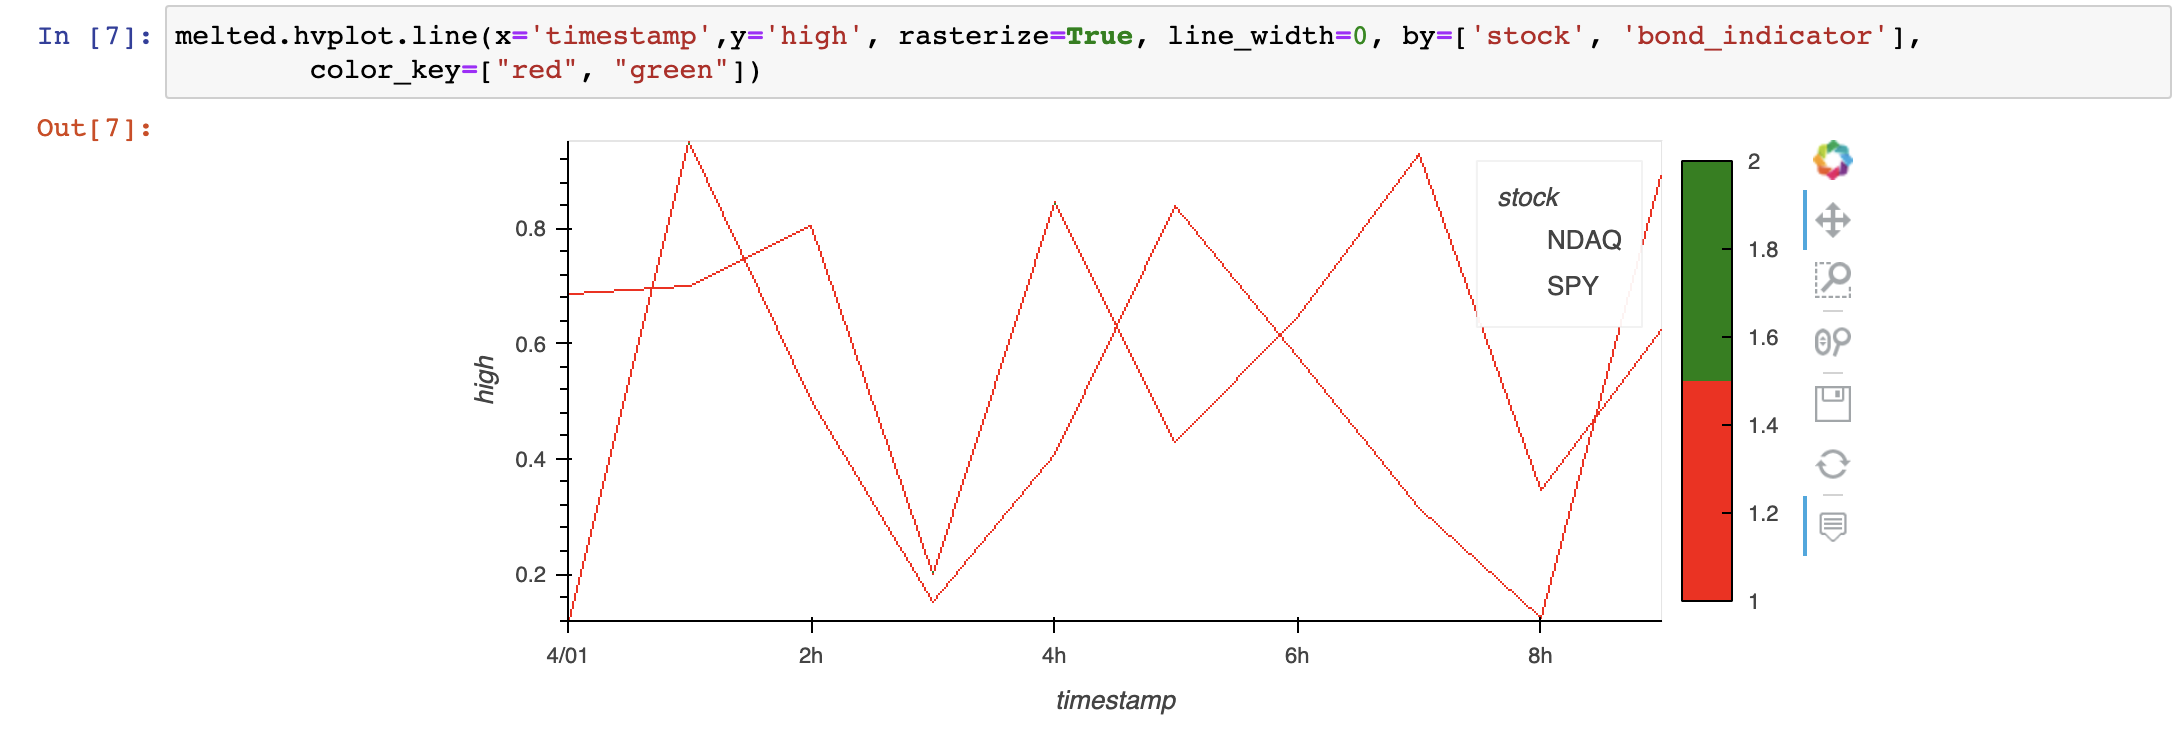
By using `line_width=0` it is possible to see that things weren't actually called correctly (only red lines):
Here is what *does* currently work:

However, you need to use `aggregator=ds.by('bond_indicator')` when the intuitive thing to do is `color='bound_indicator'`. The latter *almost* works (but not quite due to the lack of categorical handling!)

Now the 'red' color is wrong! Turns out this is due to histogram equalization in this non-categorical (float) case:

What I believe is that *both* `color='bond_indicator'` and `color_key=["#FF0000", "#00FF00"]` should force categorical: the former as the dtype is boolean and categorical should always be used when `color_key` is specified. Issue https://github.com/holoviz/hvplot/issues/941 has some suggestions for what to do when these options clash...
Contributor guide
Assessment
This issue has not been assessed yet.