Extend Referrence Documentation for bivariate
- Dominant language
- Python
- Stars
- 1.4k
- Forks
- 124
- Avg merge
- 1d 18h
- Merged PRs (30d)
- 1
Description
I'm trying to add docstrings to the `core` module. This include `.bivariate`.
In general I believe the Reference documentation is way too sparse and does not help users understand the what and how of the specific plot. But [the reference documentation for `bivariate`](https://hvplot.holoviz.org/reference/pandas/bivariate.html#pandas-gallery-bivariate) I've spend a considerable long time just understanding what type of plot this is. And I am still not sure.
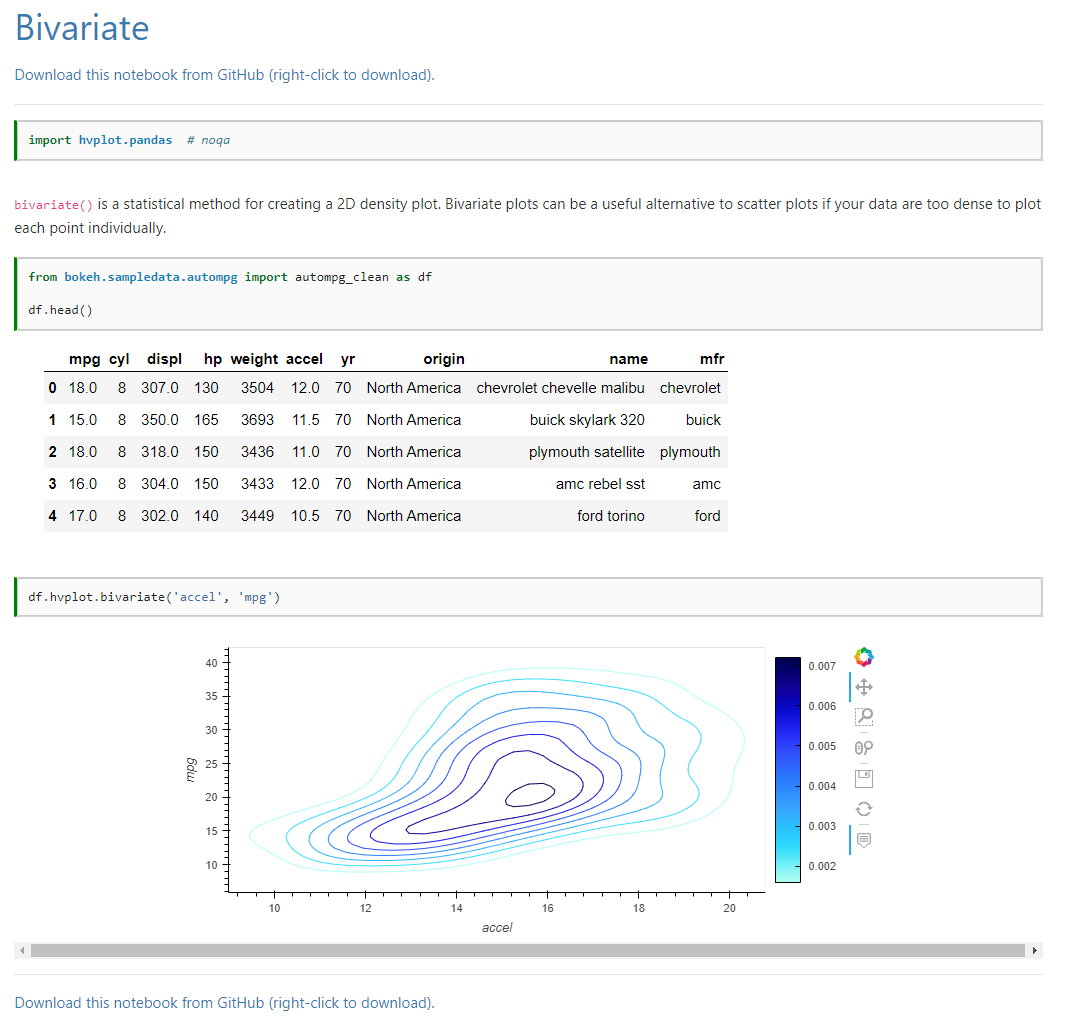
- When I [google search](https://www.google.com/search?q=bivariate+plot) for bivariate plot most of the references show something that looks close to scatter plots.
- Plotly calls this a [2D Histogram Contour](https://plotly.com/python/2d-histogram-contour/) I believe?. It is very hard for me to be sure as the hvPlot Reference does not describe the method or provide a link to a reference explanation. If I search wikipedia I again find something that does not look like a contour plot https://en.wikipedia.org/wiki/Bivariate_analysis
As
- the reference documentation is very sparse
- the name `bivariate` and short description is very unclear
- the underlying code is very difficult to follow
- Pandas `.plot` does not seem to have a similar `kind` of plot
It is so hard to understand what this is and how to use it.
My guess is that it is possible for example to add a `reduce_func` to specify the kind of aggregation done? At least plotly supports that. But I cannot find it via `hvplot.help('bivariate')`. But `group` and `groupby` are not documented there either. So I don't trust that help information 100%. And I am not capable of navigating the code within a reasonable amount of times (less than 60 secs) to figure it out. I have a similar question for `fill` as both plotly and ggplot supports this. So it would be a natural thing to support here as well.
I could add similar comments for any of the reference documentation and docstrings. Its like the documentation and implementation details are great for developers but has never been reviewed by a user. For a user it is so far from great.
Please provide
- in depth explanations and examples in the reference guide
- better lists and descriptions in `hvplot.help`.
- better docstrings
- code that can be easily navigated via "go to definition" in your editor.
Contributor guide
Assessment
This issue has not been assessed yet.