Setting projection on hvplot with xlim and ylim zooms all the way into a single point
- Dominant language
- Python
- Stars
- 1.4k
- Forks
- 124
- Avg merge
- 1d 18h
- Merged PRs (30d)
- 1
Description
#### ALL software version info
(this library, plus any other relevant software, e.g. bokeh, python, notebook, OS, browser, etc)
hvplot 0.7.2
cartopy 0.20.2
python 3.8.12
jupyterlab 3.0.16
#### Description of expected behavior and the observed behavior
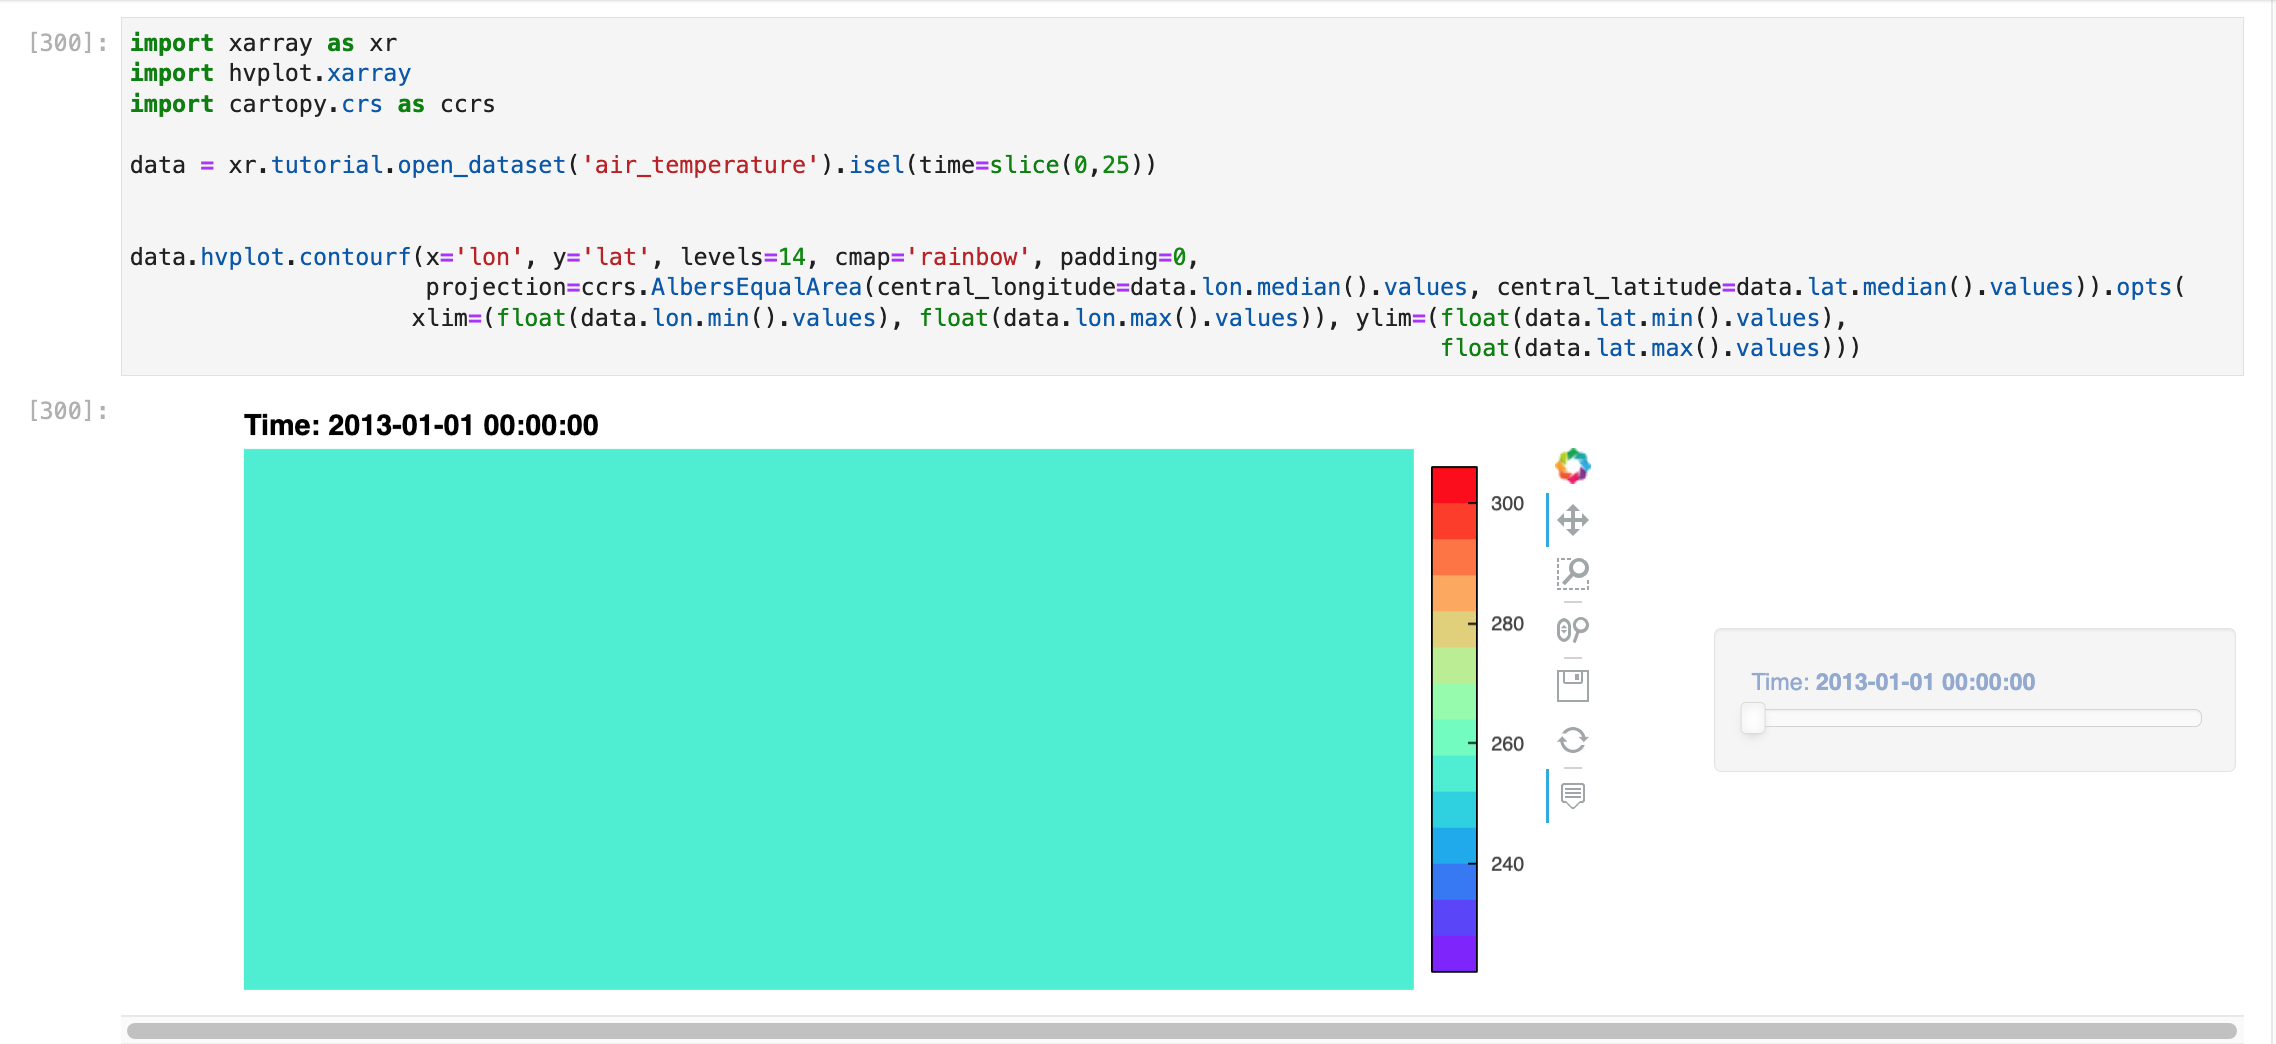
I expect that when I set a Cartopy projection on an hvplot of data that is regional with an extent/xlim + ylim set, it will show the proper xlim+ylim. Observed behavior is that when I do this, the plot view zooms all the way into a single point in the middle of the plot.
#### Complete, minimal, self-contained example code that reproduces the issue
```
import xarray as xr
import hvplot.xarray
import cartopy.crs as ccrs
data = xr.tutorial.open_dataset('air_temperature').isel(time=slice(0,25))
data.hvplot.contourf(x='lon', y='lat', levels=14, cmap='rainbow', padding=0,
projection=ccrs.AlbersEqualArea(central_longitude=data.lon.median().values, central_latitude=data.lat.median().values)).opts(
xlim=(float(data.lon.min().values), float(data.lon.max().values)), ylim=(float(data.lat.min().values), float(data.lat.max().values)))
```
Mouse zoom all the way out to see the whole plot.
#### Screenshots or screencasts of the bug in action
Contributor guide
Assessment
This issue has not been assessed yet.