support cmap parameter for line plots
- Dominant language
- Python
- Stars
- 1.4k
- Forks
- 124
- Avg merge
- 1d 18h
- Merged PRs (30d)
- 1
Description
I have a dataframe `data` with three dimensions (x,y,z) and I'd like to create a line plot where the color of the line is set by a colormap rather than randomly-chosen colors.
currently I can do
```python
data.hvplot(x='x', y='y', by='z', cmap='Reds')
```
which gives nearly the appropriate plot, except that the `cmap` parameter is ignored. This causes problems when `z` is a continuous variable rather than a categorical variable because in that case, a sequential colormap is necessary to shade each line appropriately (instead of the default categorical colormap). I'd like for the `cmap` parameter to be recognized in line graphs as it is with other types, e.g. `scatter`
for example using hvplot I can do
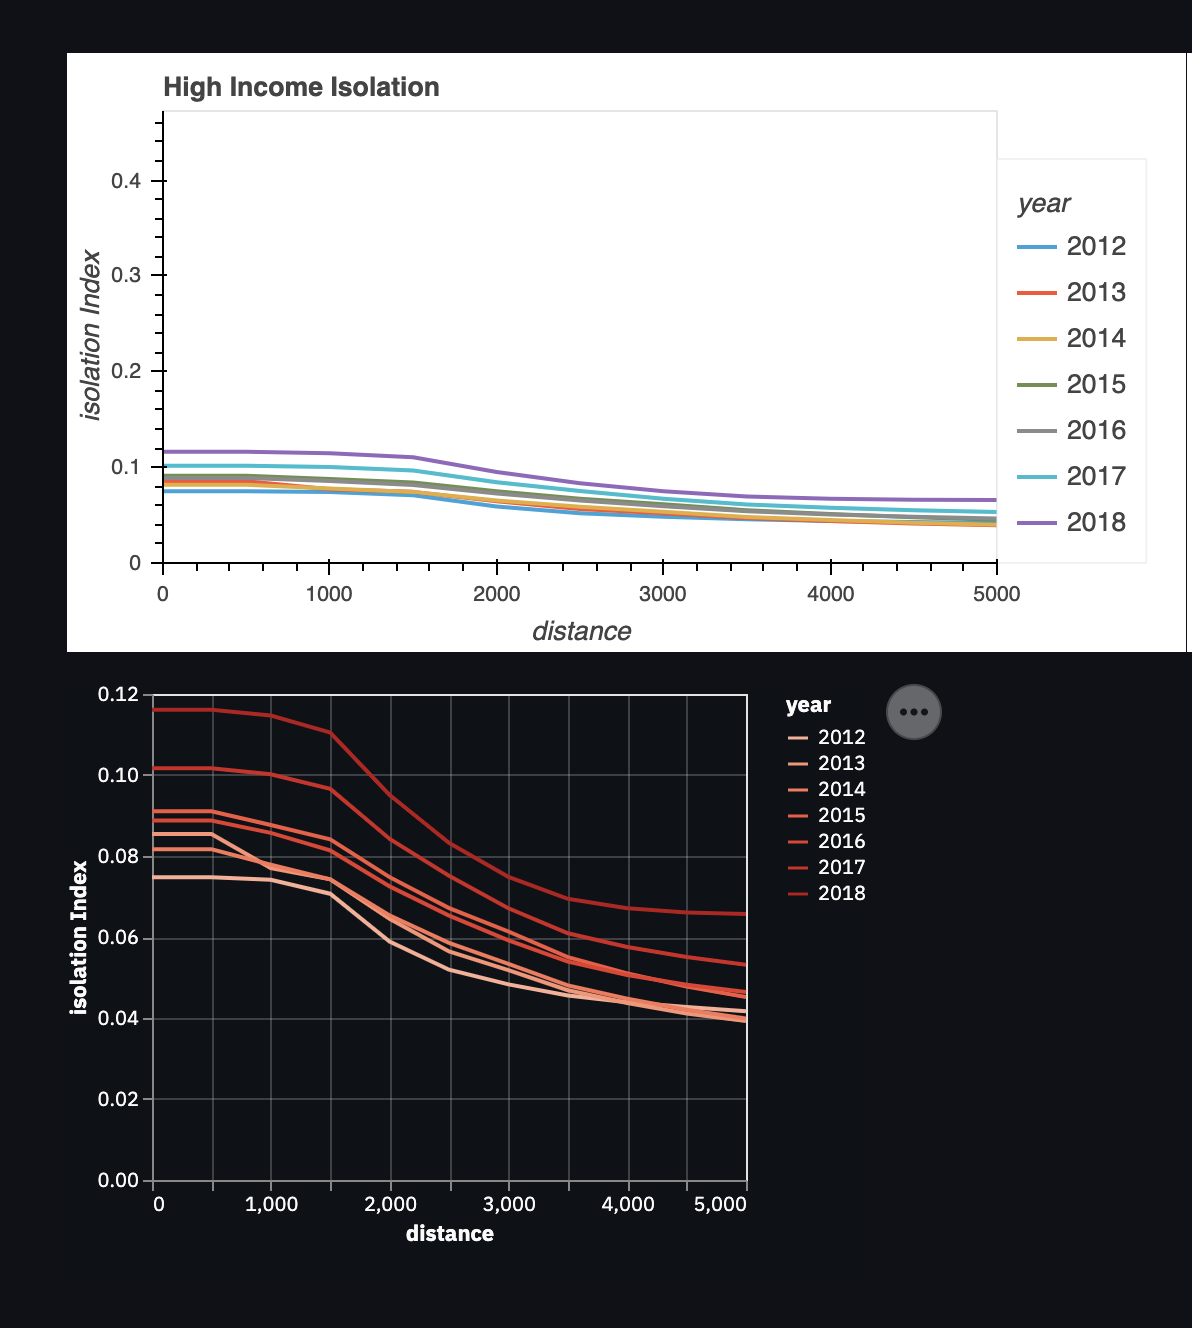
`data.hvplot(x='distance', y='Index', by='year', cmap="reds")`
which yields the top figure below (ignoring 'cmap`). Instead, I'd like to generate something like the bottom figure (created using Altair)
Contributor guide
Assessment
This issue has not been assessed yet.