Subplot for stacked bars does not produce expected results
- Dominant language
- Python
- Stars
- 1.4k
- Forks
- 124
- Avg merge
- 1d 18h
- Merged PRs (30d)
- 1
Description
### Packages
python = 3.7
matplotlib, Pandas, bokeh,hvplot,ipywidgets, nodejs= latest
#### Description of expected behavior and the observed behavior
Hello all,
I am experiencing what I think is a bug in the way hvplot handles subplots for bar charts, particularly stacked bars).
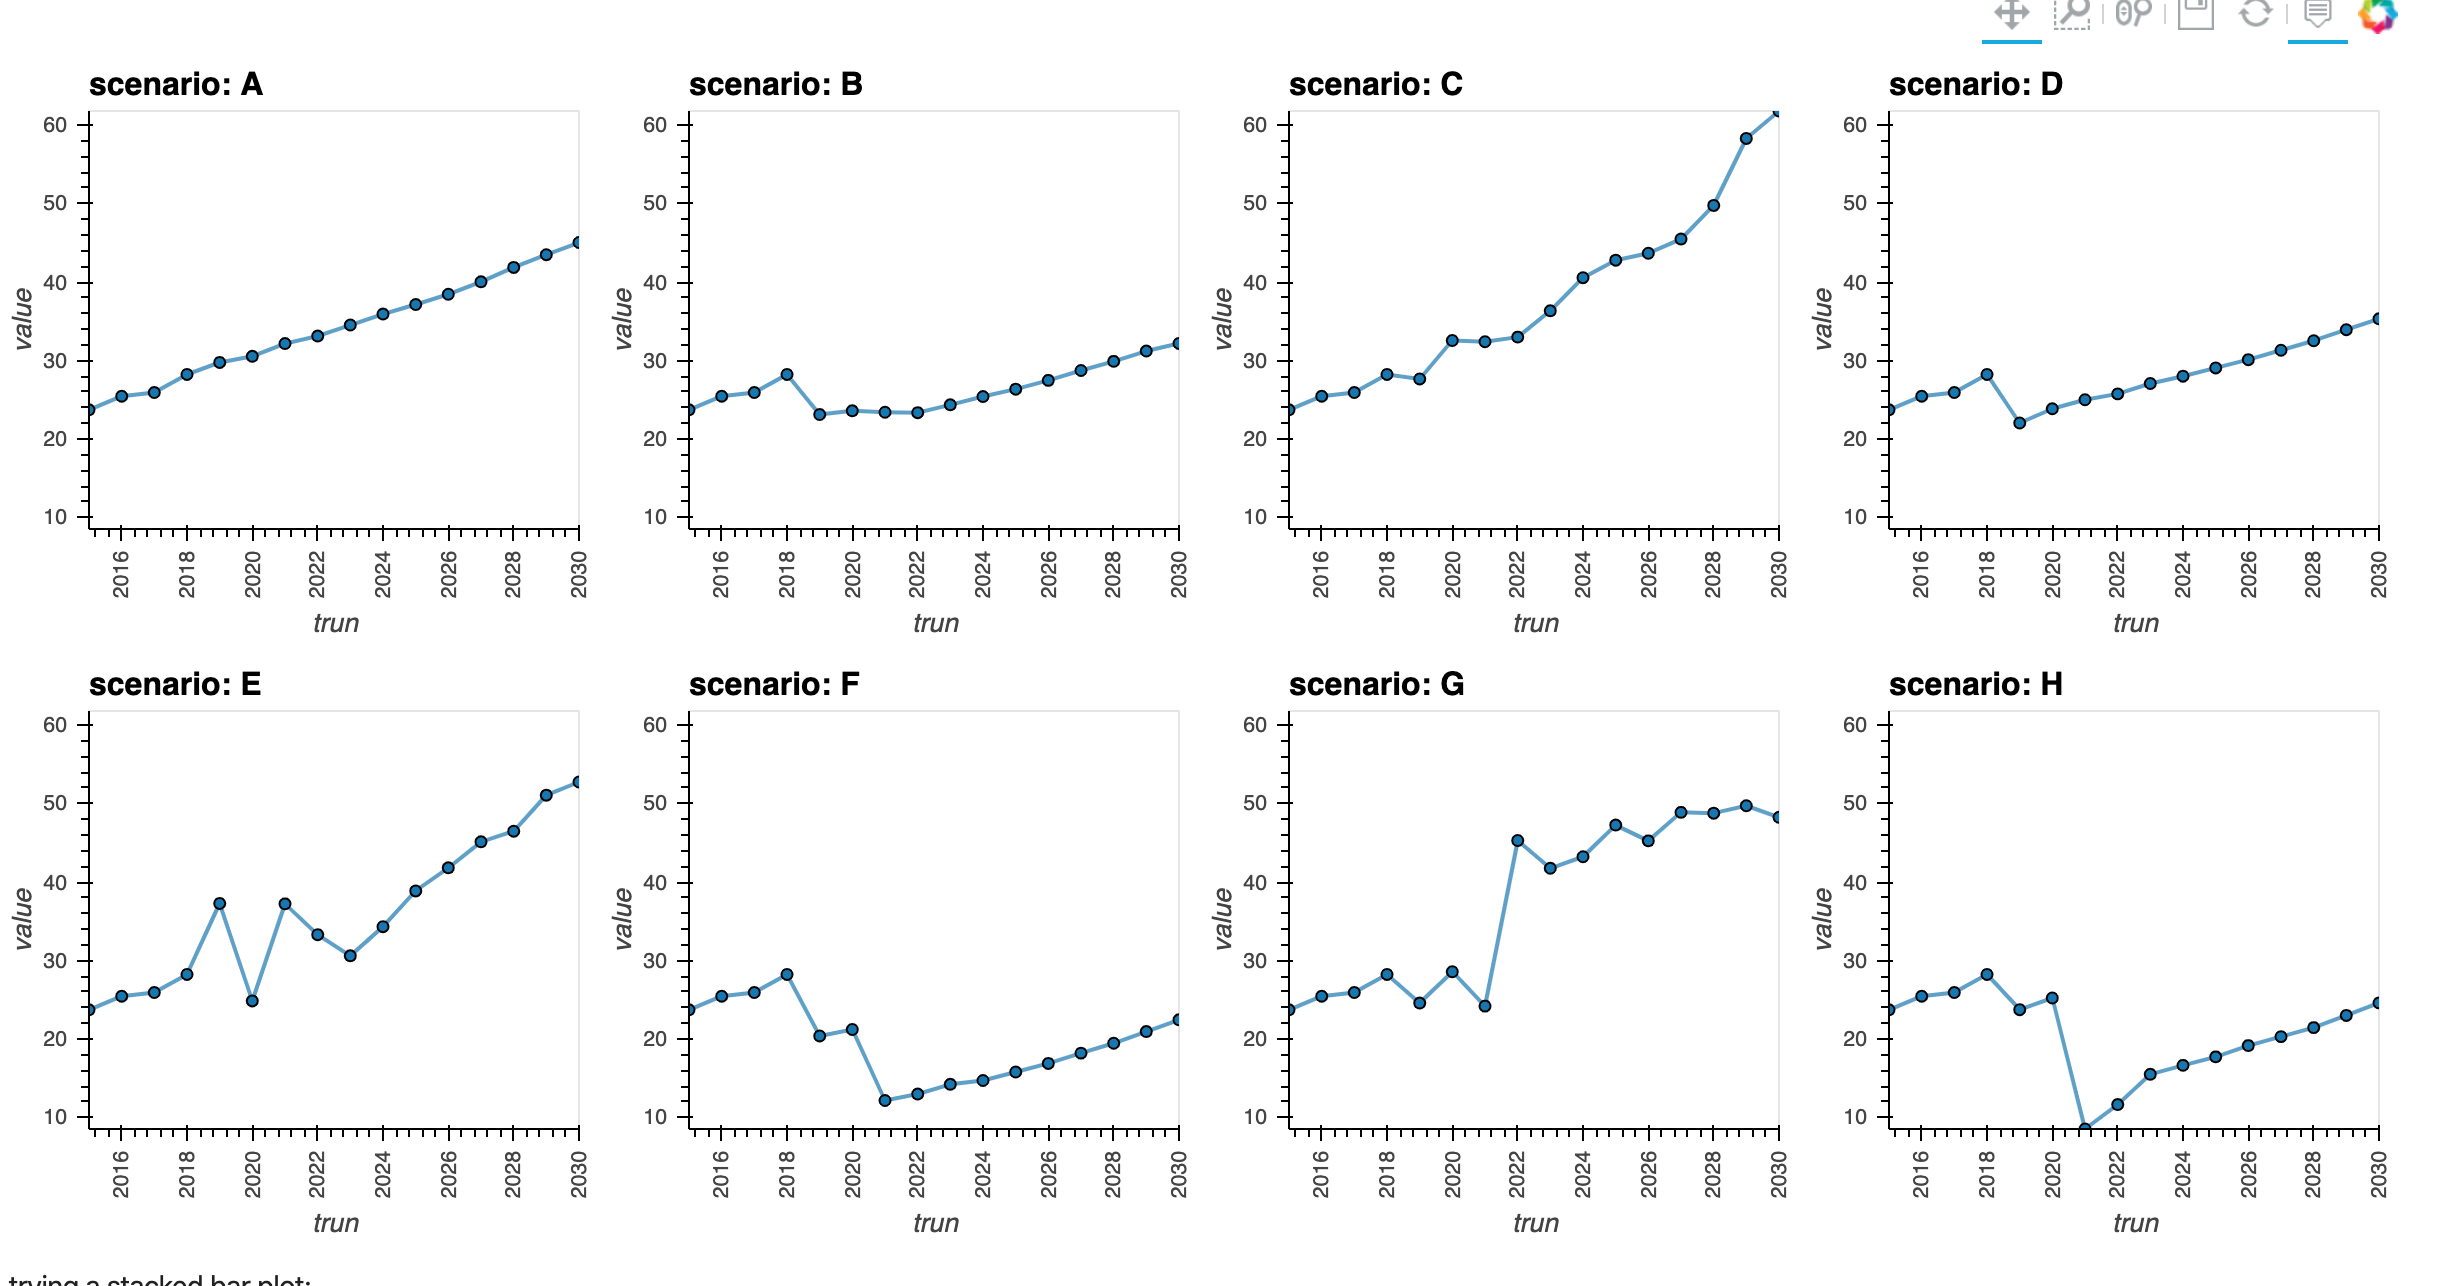
Following the example in the [subplots documentation](https://hvplot.holoviz.org/user_guide/Subplots.html) I am able to create a scatterplot with subplots as expected. The dataframe is:
```
# Column Non-Null Count Dtype
--- ------ -------------- -----
0 trun 768 non-null int64
1 c 768 non-null object
2 value 768 non-null float64
3 scenario 768 non-null object
```
and I am able to produce scatter plots for each scenario by selecting an unique entry in c and using ```x='trun', y='value', by='scenario',subplots=True```
I then try a different dataframe with one more column (representing fuels):
```
# Column Non-Null Count Dtype
--- ------ -------------- -----
0 c 1346 non-null object
1 trun 1346 non-null int64
2 f 1346 non-null object
3 value 1346 non-null float64
4 scenario 1346 non-null object
```
and use `hvplot.bar(x='trun', y='value', by='scenario', stacked=True, subplots=True` , individual subplots for each scenario are plotted but without stacking.
If I pivot and pass a list of columns as the y variable, only the first element of the y list is plotted.
#### Complete, minimal, self-contained example code that reproduces the issue
I shared the code to a repo here: https://github.com/wogandavid/example
#### Screenshots or screencasts of the bug in action
Correct behavior:
Incorrect behavior with bar (stacked):

Manually adding overlays with the expected elements (not ideal):

One more example when pivoting the columns (only first column is plotted):

Contributor guide
Assessment
This issue has not been assessed yet.