No plot produced when xticks and xtick labels specified in hvplot
- Dominant language
- Python
- Stars
- 1.4k
- Forks
- 124
- Avg merge
- 1d 18h
- Merged PRs (30d)
- 1
Description
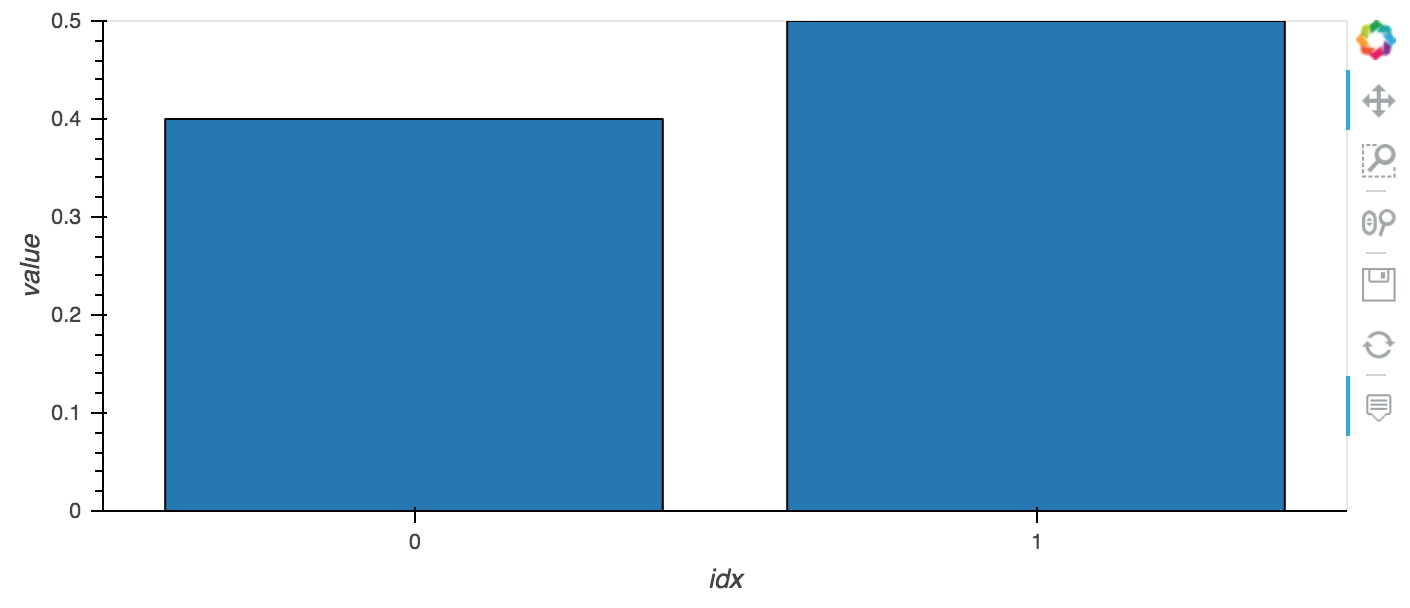
Hi, I notice that when I specify xticks as a list of tuples of (coordinate, label), no plot is produced. If I don't include this option, then I get a plot. See example below.
```
import pandas as pd
import hvplot.pandas
test = pd.DataFrame({'idx': [0, 1], 'value': [0.4, 0.5]})
(
test
.hvplot(
x='idx',
y='value',
kind='bar'))
```
```
test = pd.DataFrame({'idx': [0, 1], 'value': [0.4, 0.5]})
(
test
.hvplot(
x='idx',
y='value',
kind='bar',
xticks=[(0, 'a'), (1, 'b')]))
```

I am using pandas version 0.25.1, hvplot version 0.4.0, inside Jupyter Lab version 1.1.4
Contributor guide
Assessment
This issue has not been assessed yet.