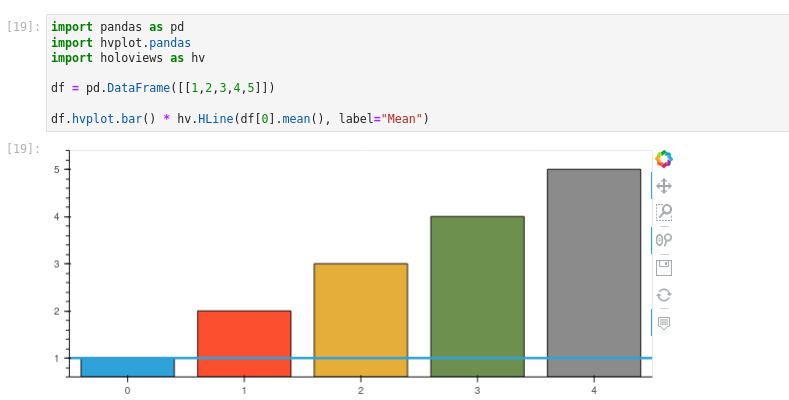
Label doesn't work with HLine
Open
- Dominant language
- Python
- Stars
- 1.4k
- Forks
- 124
- Avg merge
- 1d 18h
- Merged PRs (30d)
- 1
Description
#### ALL software version info
Python 3.10.6
hvplot==0.8.3
holoviews==1.15.4
bokeh==2.4.3
jupyterlab==3.6.3
#### Description of expected behavior and the observed behavior
Should be able to add a label to HLine.
#### Complete, minimal, self-contained example code that reproduces the issue
```python
import pandas as pd
import hvplot.pandas
import holoviews as hv
df = pd.DataFrame([[1,2,3,4,5]])
df.hvplot.bar() * hv.HLine(df[0].mean(), label="Mean")
```
Contributor guide
Assessment
This issue has not been assessed yet.