xarray hvplot not respecting fixed clim with interactive slider
- Dominant language
- Python
- Stars
- 1.4k
- Forks
- 124
- Avg merge
- 1d 18h
- Merged PRs (30d)
- 1
Description
#### ALL software version info
(this library, plus any other relevant software, e.g. bokeh, python, notebook, OS, browser, etc)
```
Linux jupyter-dshean 5.10.147+ #1 SMP Thu Nov 10 04:41:53 UTC 2022 x86_64 x86_64 x86_64 GNU/Linux
bokeh 2.4.3 pyhd8ed1ab_3 conda-forge
holoviews 1.15.4 pyhd8ed1ab_0 conda-forge
hvplot 0.8.2 pyhd8ed1ab_0 conda-forge
jupyterlab 3.6.1 pyhd8ed1ab_0 conda-forge
notebook 6.4.12 pyha770c72_0 conda-forge
python 3.10.9 he550d4f_0_cpython conda-forge
xarray 2023.2.0 pyhd8ed1ab_0 conda-forge
```
#### Description of expected behavior and the observed behavior
I have xarray dataset with (x,y,time) coordinates for a few variables. I'm creating scatterplot using marker color to visualize data values and hoping to set fixed clim for the colorbar.
When adjusting the time slider, the colorbar is dynamically updated based on data values (presumably min/max) for that time coordinate. I expect the clim to be fixed if specified.
Note that when using `rasterize=True` the clim are held fixed.
#### Complete, minimal, self-contained example code that reproduces the issue

```
ds.hvplot(kind='scatter', x='x', y='y', c='SNWD_D', aspect='equal', cmap='inferno', s=5, clim=(0,150))
```
#### Screenshots or screencasts of the bug in action


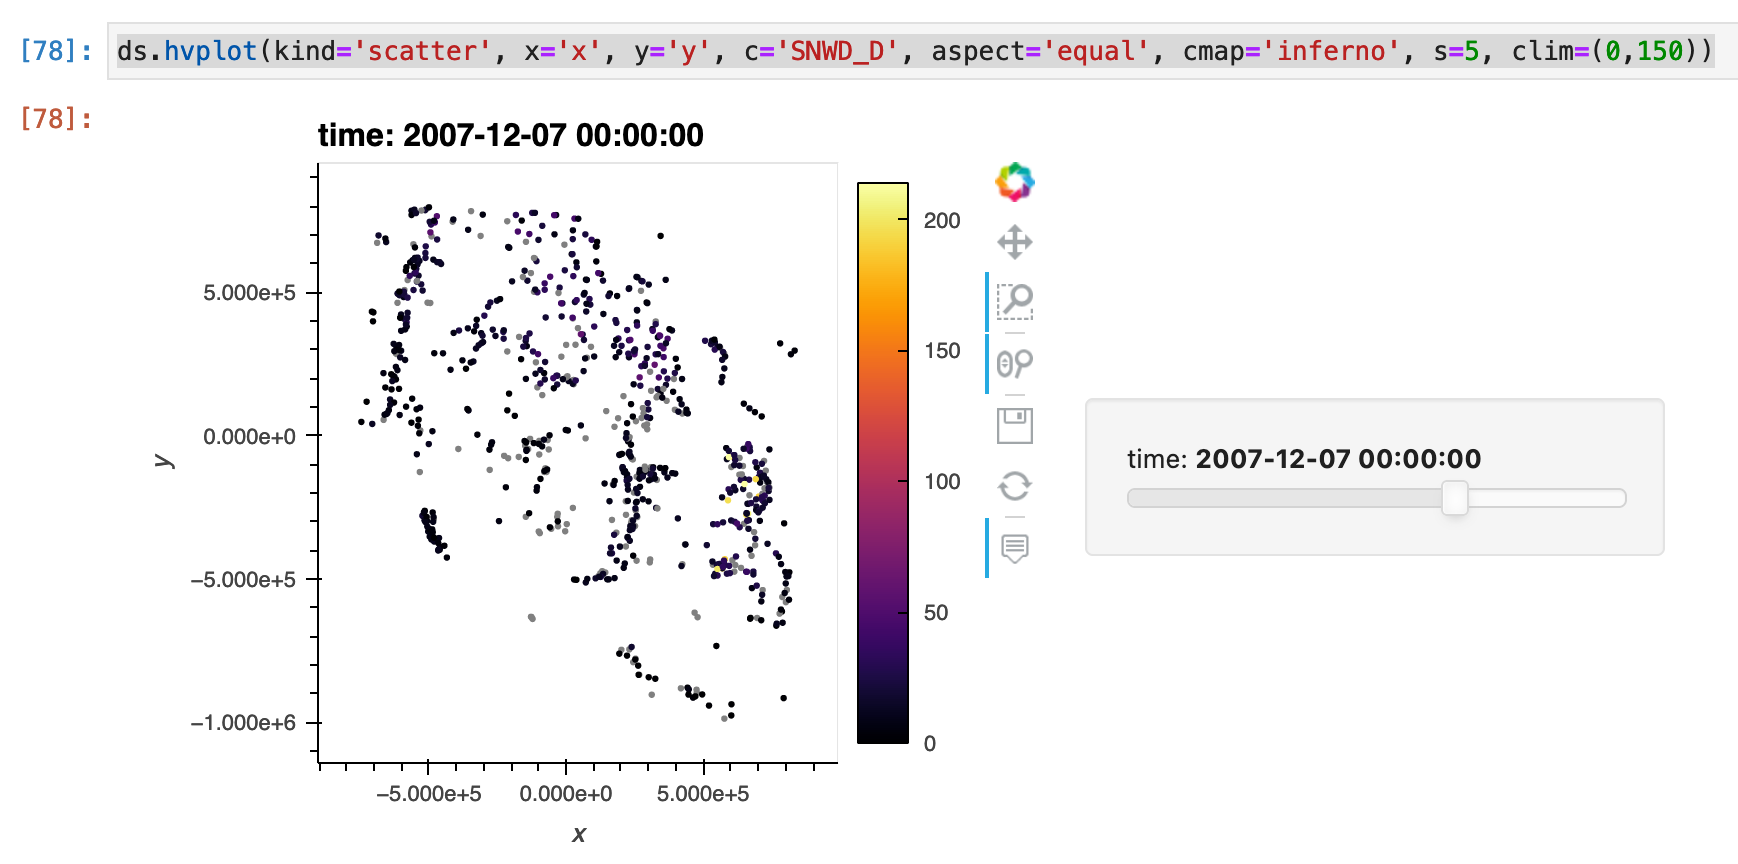
Contributor guide
Assessment
This issue has not been assessed yet.