y argument not working for Bar plot with multiindex
- Dominant language
- Python
- Stars
- 1.4k
- Forks
- 124
- Avg merge
- 1d 18h
- Merged PRs (30d)
- 1
Description
While working on https://github.com/holoviz/hvplot/pull/1032 I noticed the same issue as mentioned by @sophiamyang in https://github.com/holoviz/hvplot/issues/830. I tried to address the issue by specifying the `y` argument. But it actually does not work!
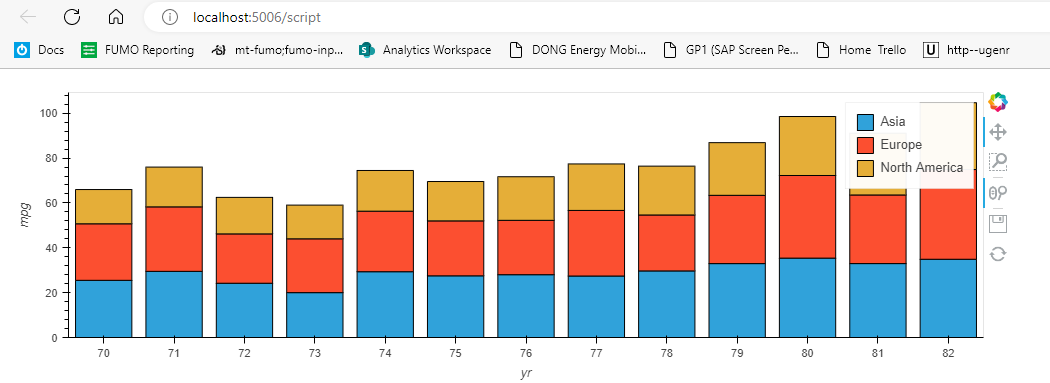
The below is from the current pandas `bar` reference notebook where I try to specify `y`.

```python
import hvplot.pandas # noqa
from bokeh.sampledata.autompg import autompg_clean as df
table = df.groupby(['yr', 'origin']).mean()
plot = table.hvplot.bar(stacked=True, height=500, legend='top_left', y="mpg")
import panel as pn
pn.extension()
pn.panel(plot).servable()
```
## Works with HoloViews
I can get the below example using HoloViews working. So I believe this is a hvPlot issue
```python
import holoviews as hv # noqa
from bokeh.sampledata.autompg import autompg_clean as df
table = df.groupby(['yr', 'origin']).mean()
plot = hv.Bars(table, kdims=["yr", "origin"], vdims="mpg").opts(width=1000, stacked=True)
import panel as pn
pn.extension()
pn.panel(plot).servable()
```
## Versions
hvplot: main branch, holoviews: 1.15.4, panel: 0.14.4
Contributor guide
Assessment
This issue has not been assessed yet.