dsshow savefig error with matplotlib pdf and svg export. Shading intensity variation in png export.
- Dominant language
- Python
- Stars
- 3.6k
- Forks
- 376
- Avg merge
- 4h 32m
- Merged PRs (30d)
- 1
Description
#### ALL software version info
redhat:enterprise_linux:7.9
Linux 3.10.0-1160.49.1.el7.x86_64
Python 3.8.12
Matplotlib 3.2.2
datashader 0.14.0
pandas 1.1.3
numpy 1.21.6
#### Description of expected behavior and the observed behavior
The datashader plotted points should be the same size as the ax and export well but the scale is off and changes with dpi export settings. Additionally, the shading intensity is variable for png export.
#### Complete, minimal, self-contained example code that reproduces the issue
```
import matplotlib
import matplotlib.pyplot as plt
import datashader as ds
from datashader.mpl_ext import dsshow
import pandas as pd
import numpy as np
# Fake data for testing
x = np.random.normal(size=100000)
y = x * 3 + np.random.normal(size=100000)
fig, ax = plt.subplots()
dsartist = dsshow(
df,
ds.Point("xs", "ys"),
ds.count(),
vmin=0,
vmax=100,
norm="linear",
aspect="auto",
ax=ax
)
plt.title('300 dpi')
fig.savefig(test_300dpi.pdf, dpi=300)
fig.savefig(test_300dpi.png, dpi=300)
fig.savefig('test_300dpi.svg', dpi=300)
plt.close()
fig, ax = plt.subplots()
dsartist = dsshow(
df,
ds.Point("xs", "ys"),
ds.count(),
vmin=0,
vmax=100,
norm="linear",
aspect="auto",
ax=ax
)
plt.title('default dpi')
fig.savefig(test_defaultdpi.pdf)
fig.savefig(test_defaultdpi.png)
fig.savefig('test_defaultdpi.svg')
plt.close()
```
#### Screenshots or screencasts of the bug in action


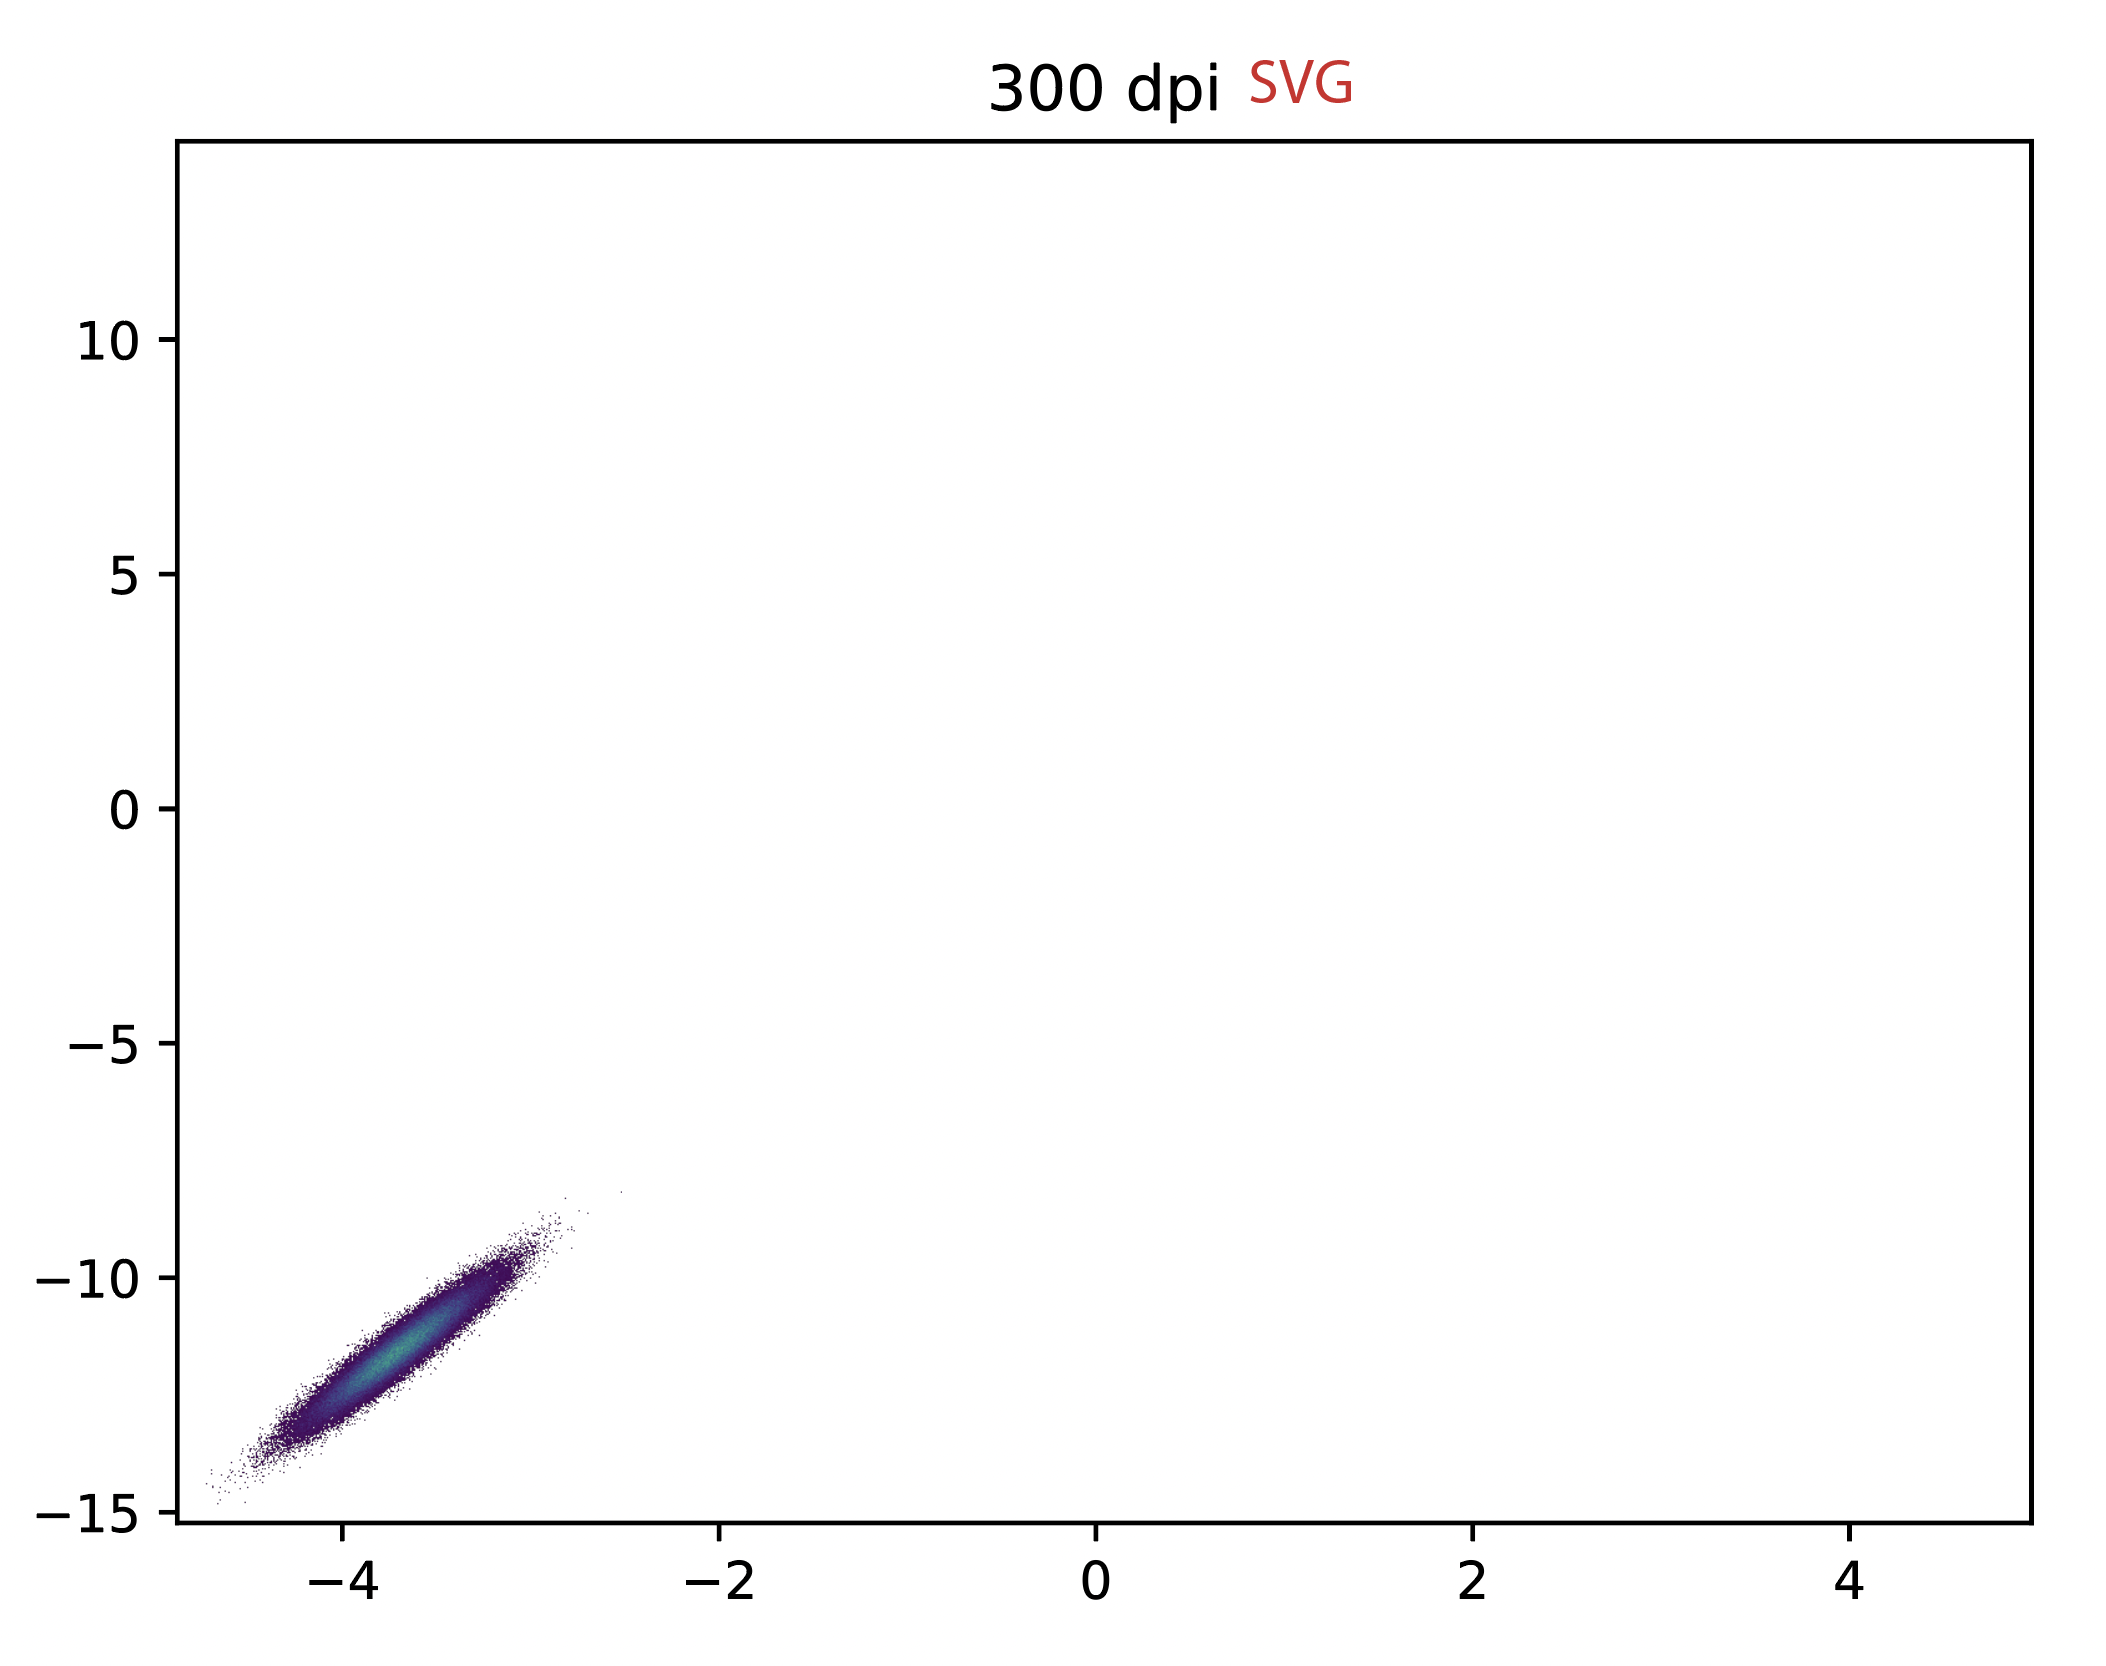

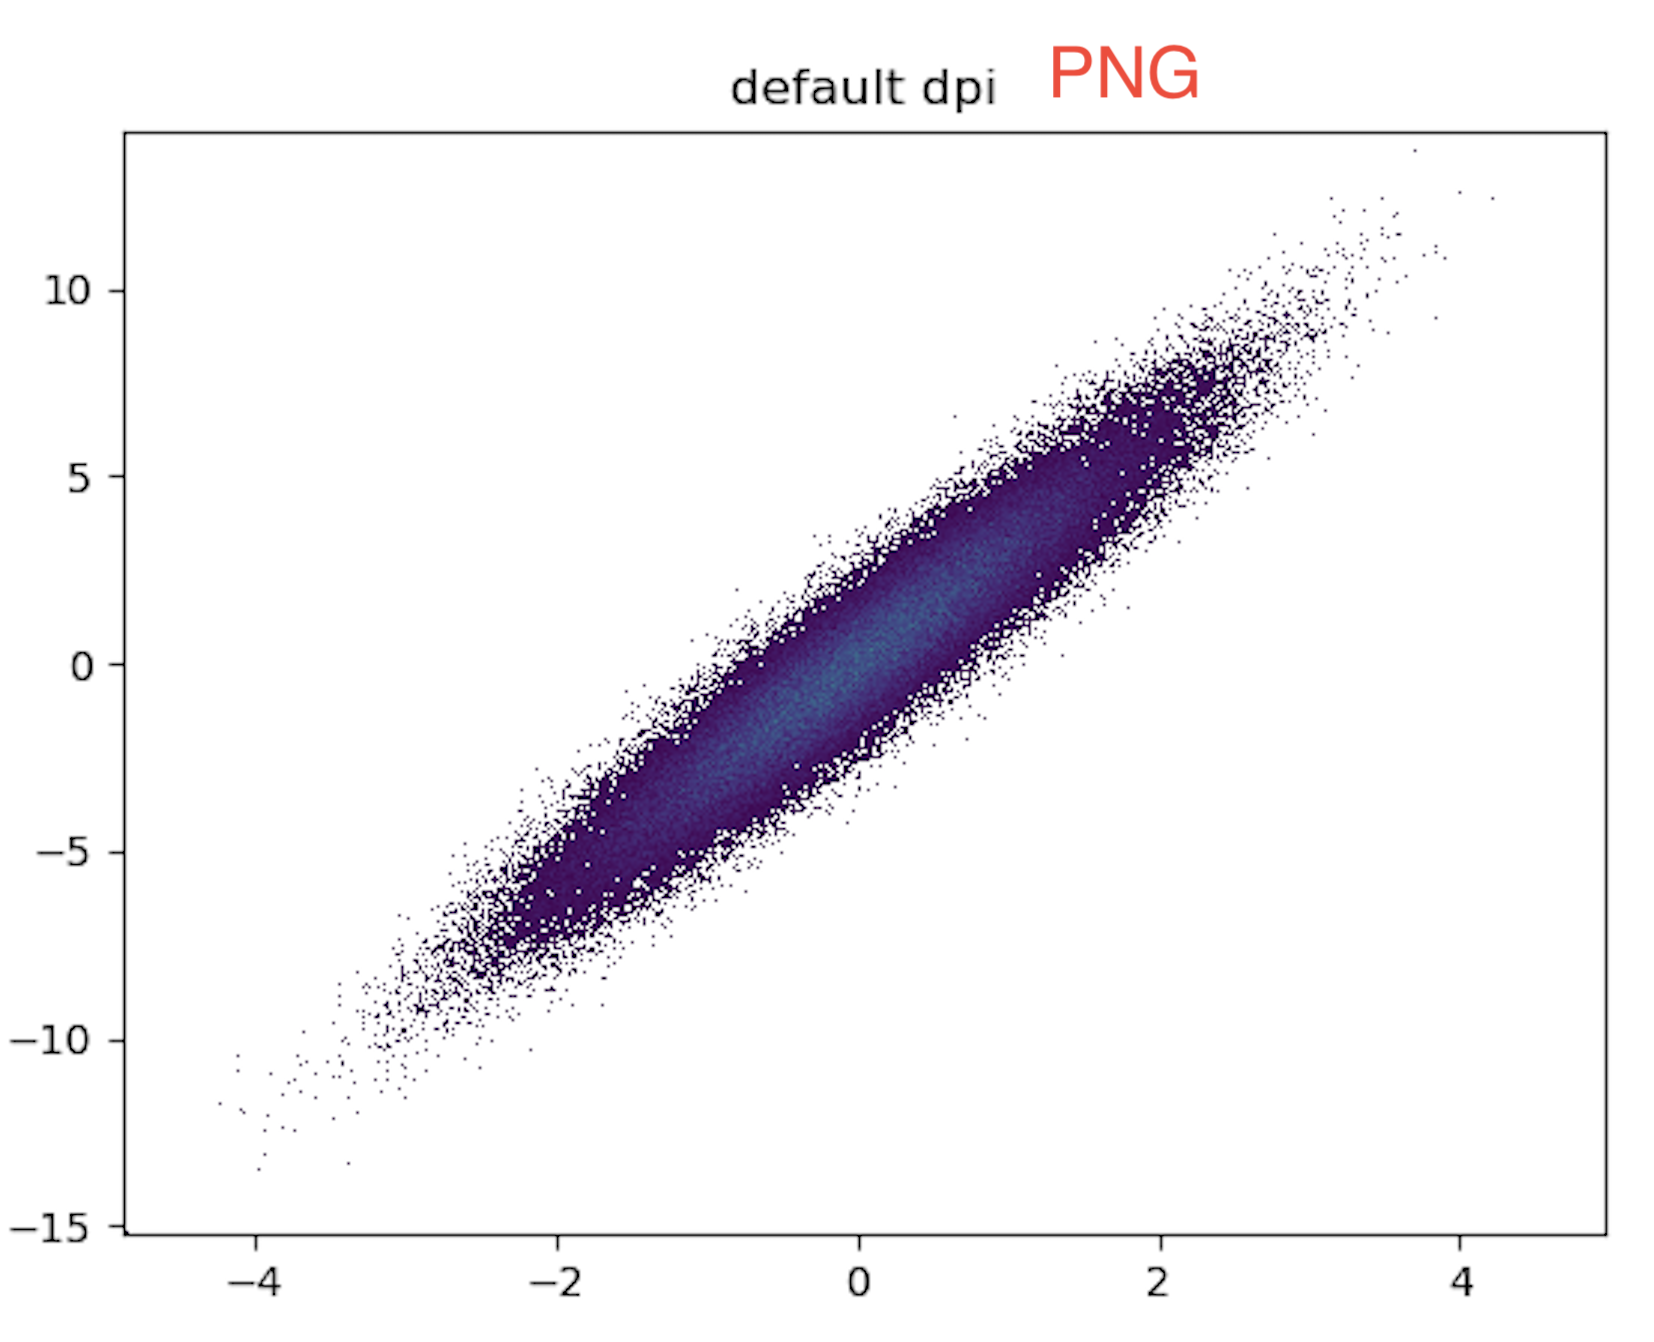
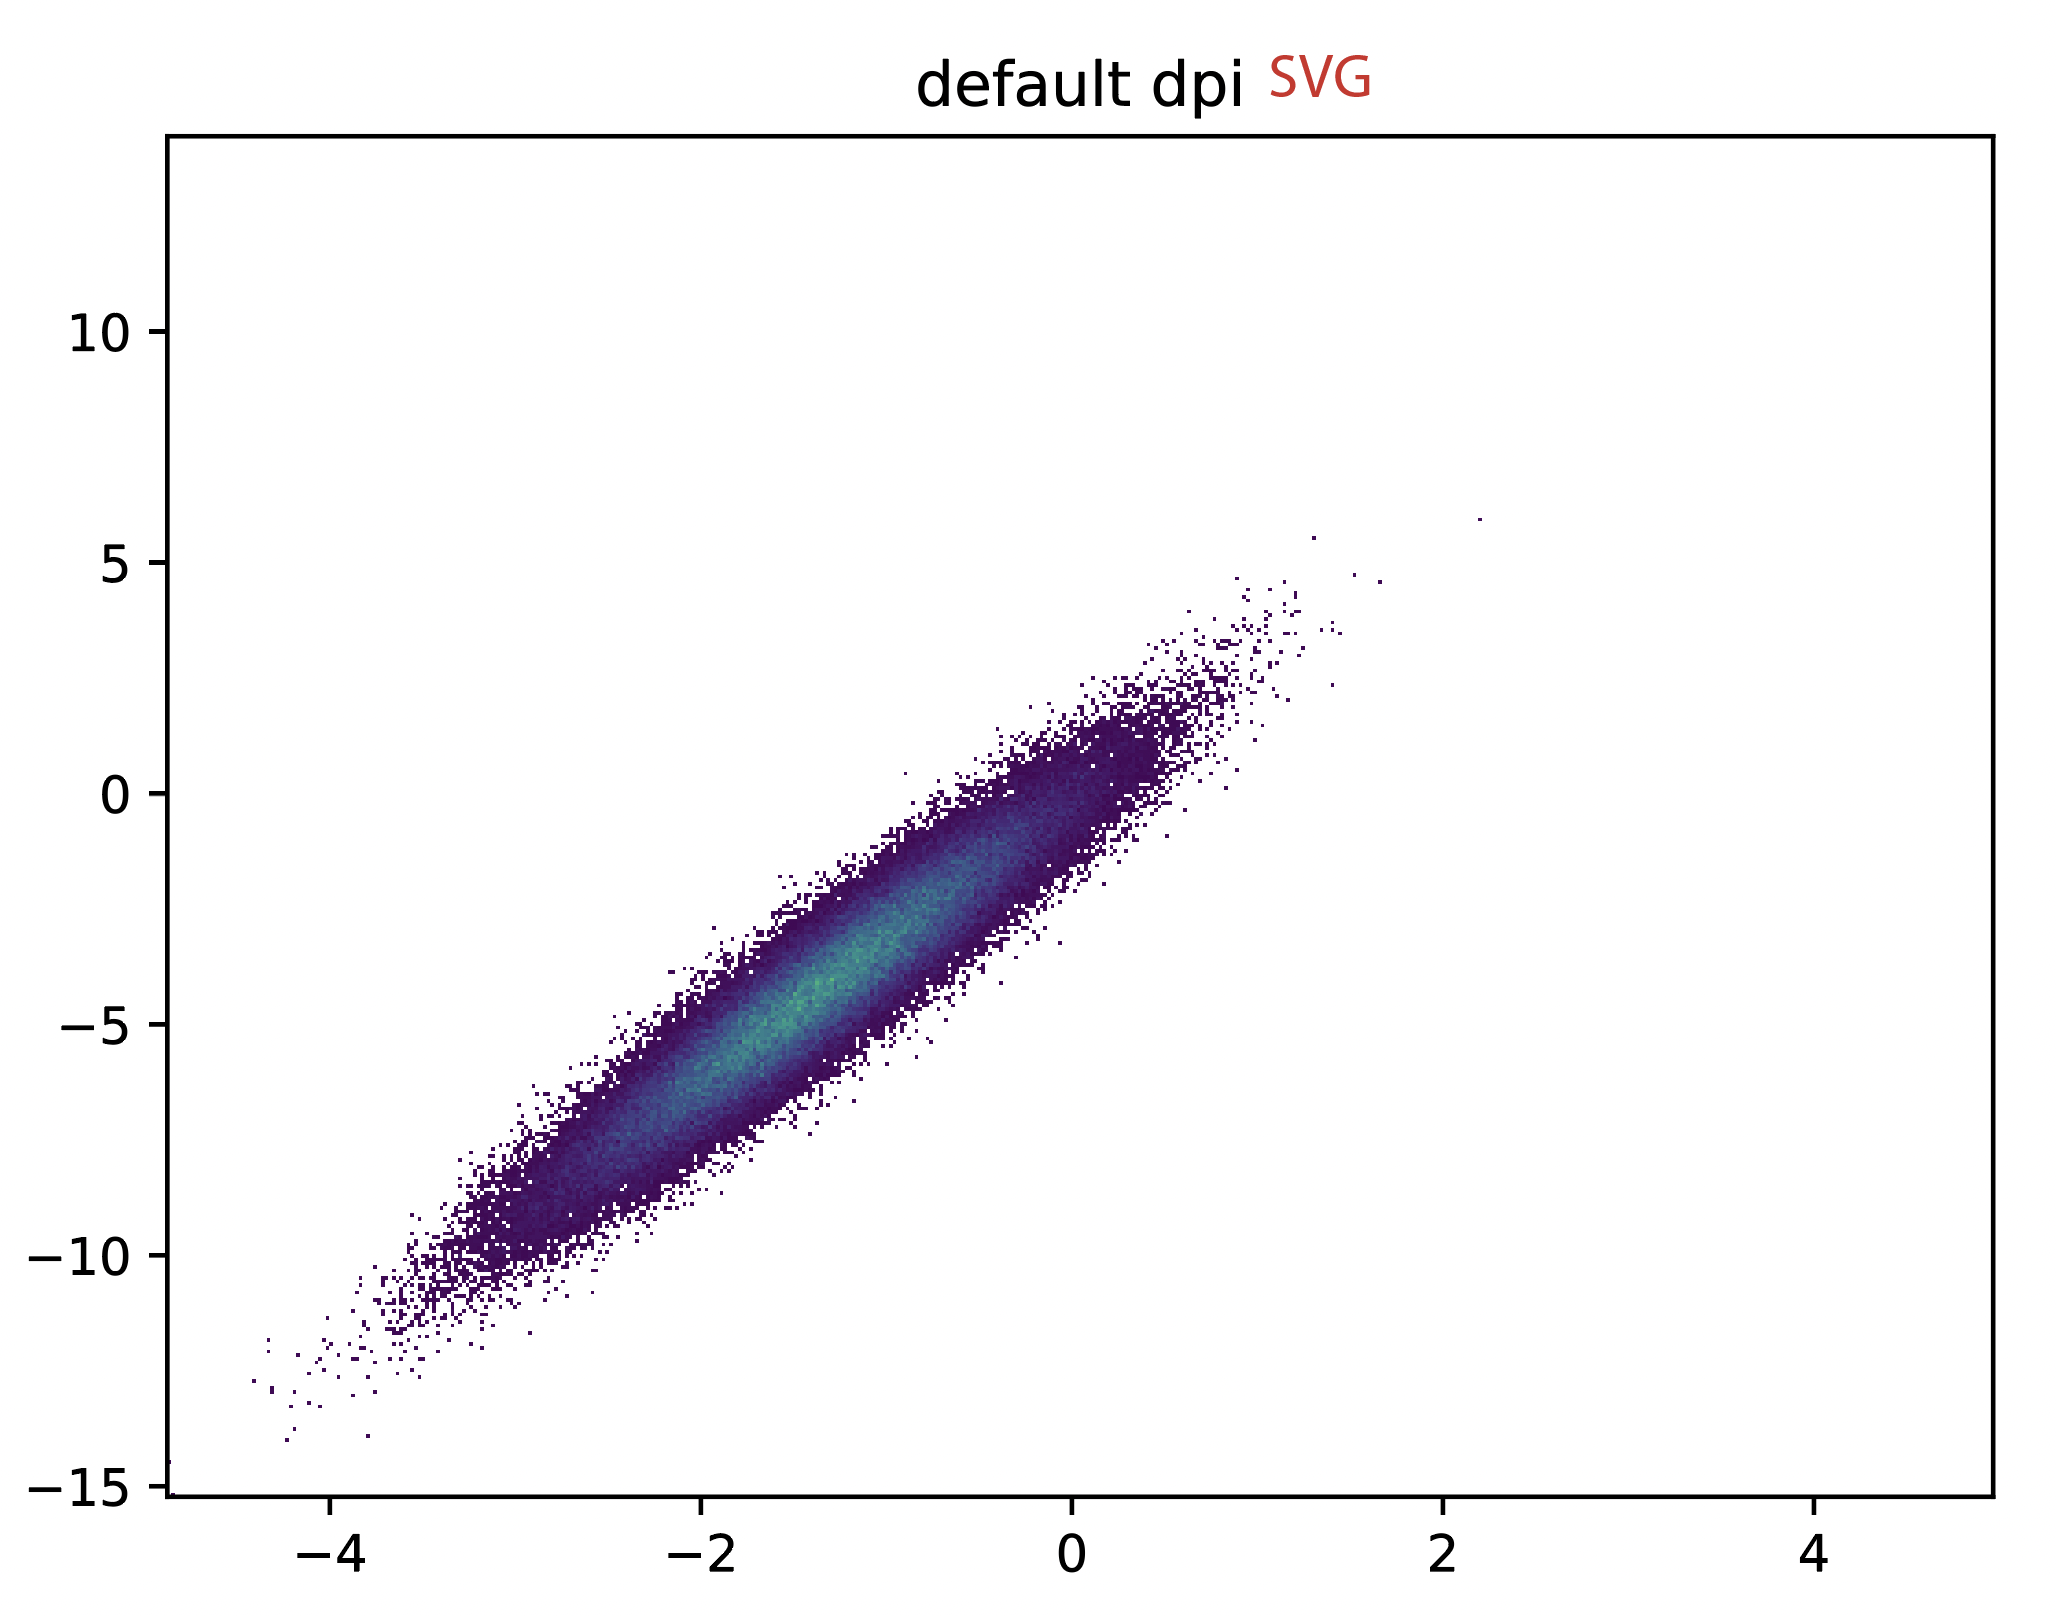
Contributor guide
No contributing guide indexed for this repository
Research direction
Start with dsshow from datashader.mpl_ext and the Matplotlib fig.savefig calls in the reproduction. Compare the PDF, SVG, and PNG outputs at default and 300 dpi, checking the reported scale, export error, and shading variation. Done means the plotted points retain the expected size and shading consistently across the listed formats and dpi settings.
Written by the indexing model from the issue text.
Assessment
- Tech stack
- matplotlib, python
- Domain
- data-visualization
- Issue type
- Bug
- Difficulty
- 4/5
- Estimated time
- 3-5 days
- Activity status
- Stale
- Clarity
- Mostly clear
- Newbie friendliness
- 35/100