hoffstadt / hoffstadt/DearPyGui
bad performance for heatmaps
- Dominant language
- C++
- Stars
- 15.6k
- Forks
- 783
- PR merge metrics
- No merged PRs in 30d
Description
----
## Version of Dear PyGui
Version: 1.7.3
Operating System: win10 & win11
## My Issue/Question
Hi,
what are the best ways of improving a heat map display
image
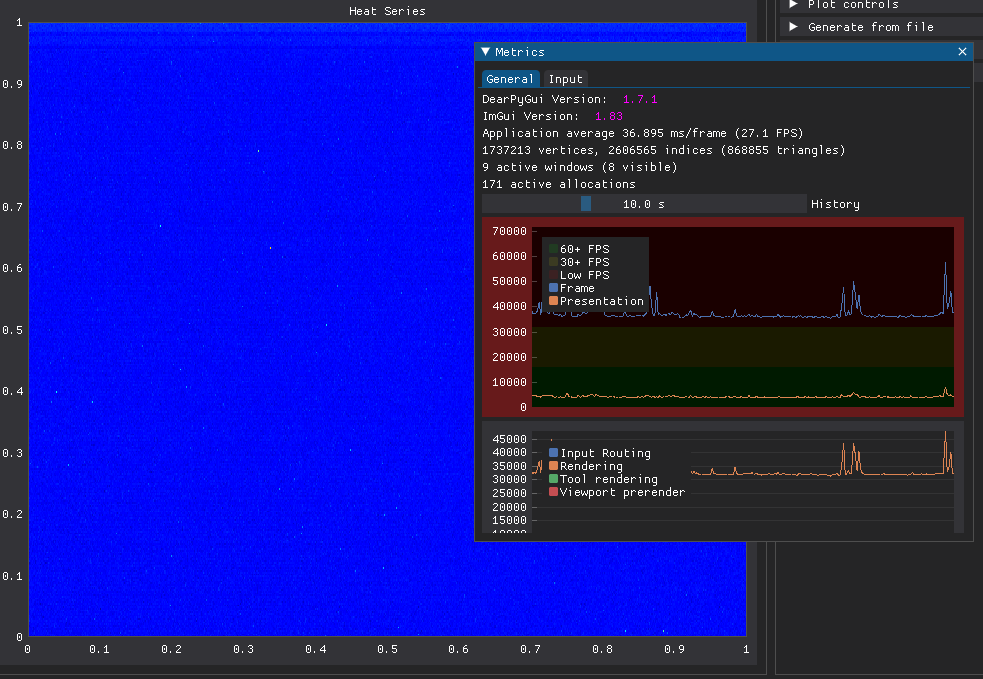
I get quite some sluggishness when displaying a 3D numpy array of 1200 by 360
when looking at this example https://www.youtube.com/watch?v=GPoQYTfQMxw it looks better, but i cannot make anything of his code https://github.com/Tschucker/Python-Digital-Phosphor-Display
I've written this post on the discord https://discordapp.com/channels/736279277242417272/1031629960126939277/1031629960126939277 but i feel this is some sort of bug since the performance for imgui is much better, so my guess is that there is some bottleneck somewhere in the python code.
## To Reproduce
run the code below and look at the performance. the large the image the worst it gets (obviously)
## Expected behavior
60fps as it is with textures
## Screenshots/Video
## Standalone, minimal, complete and verifiable example
```python
import dearpygui.dearpygui as dpg
import numpy as np
dpg.create_context()
dpg.show_tool(dpg.mvTool_Metrics)
with dpg.window(label="Tutorial", width=400, height=400):
values = np.random.rand(1200,360)
with dpg.group(horizontal=True):
dpg.add_colormap_scale(min_scale=values.min(), max_scale=values.max(), colormap=dpg.mvPlotColormap_Jet, tag=f"_legend")
with dpg.plot(label="Performance test", height=-1, width=-1, crosshairs=True, anti_aliased =False, delay_search=True):
dpg.bind_colormap(dpg.last_item(), dpg.mvPlotColormap_Jet)
dpg.add_plot_axis(dpg.mvXAxis, tag=f"_x_axis", no_tick_marks=False, no_gridlines=False)
dpg.add_plot_axis(dpg.mvYAxis, tag=f"_y_axis", no_tick_marks=False, no_gridlines=False)
dpg.add_heat_series(values.flatten().tolist(), values.shape[0], values.shape[1], parent =f"_y_axis", scale_min=values.min(), scale_max=values.max(), format="", tag=f"_plot", bounds_max=[values.shape[0]-0.5, values.shape[1]-0.5], bounds_min=[-0.5, -0.5])
dpg.create_viewport(title='Custom Title', width=800, height=600)
dpg.setup_dearpygui()
dpg.show_viewport()
dpg.start_dearpygui()
dpg.destroy_context()
```
Contributor guide
Assessment
This issue has not been assessed yet.